Fake Banner
Summer Lectures In AI

Winter is not over yet, but I am already busy fixing the details of some conferences, schools,...

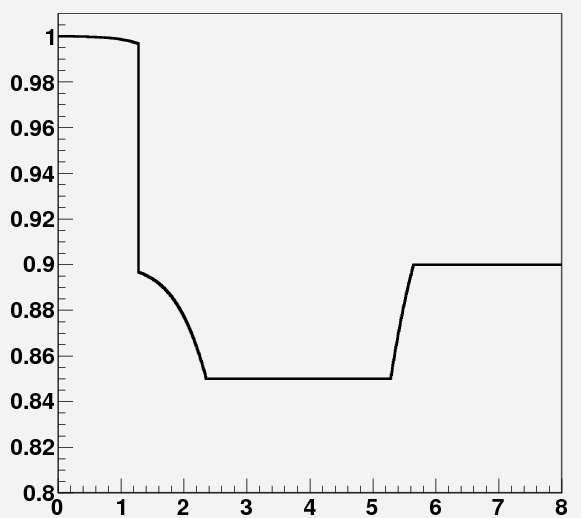
Unsupervised Tracking

Pattern recognition is an altisonant name to a rather common, if complex, activity we perform countless...

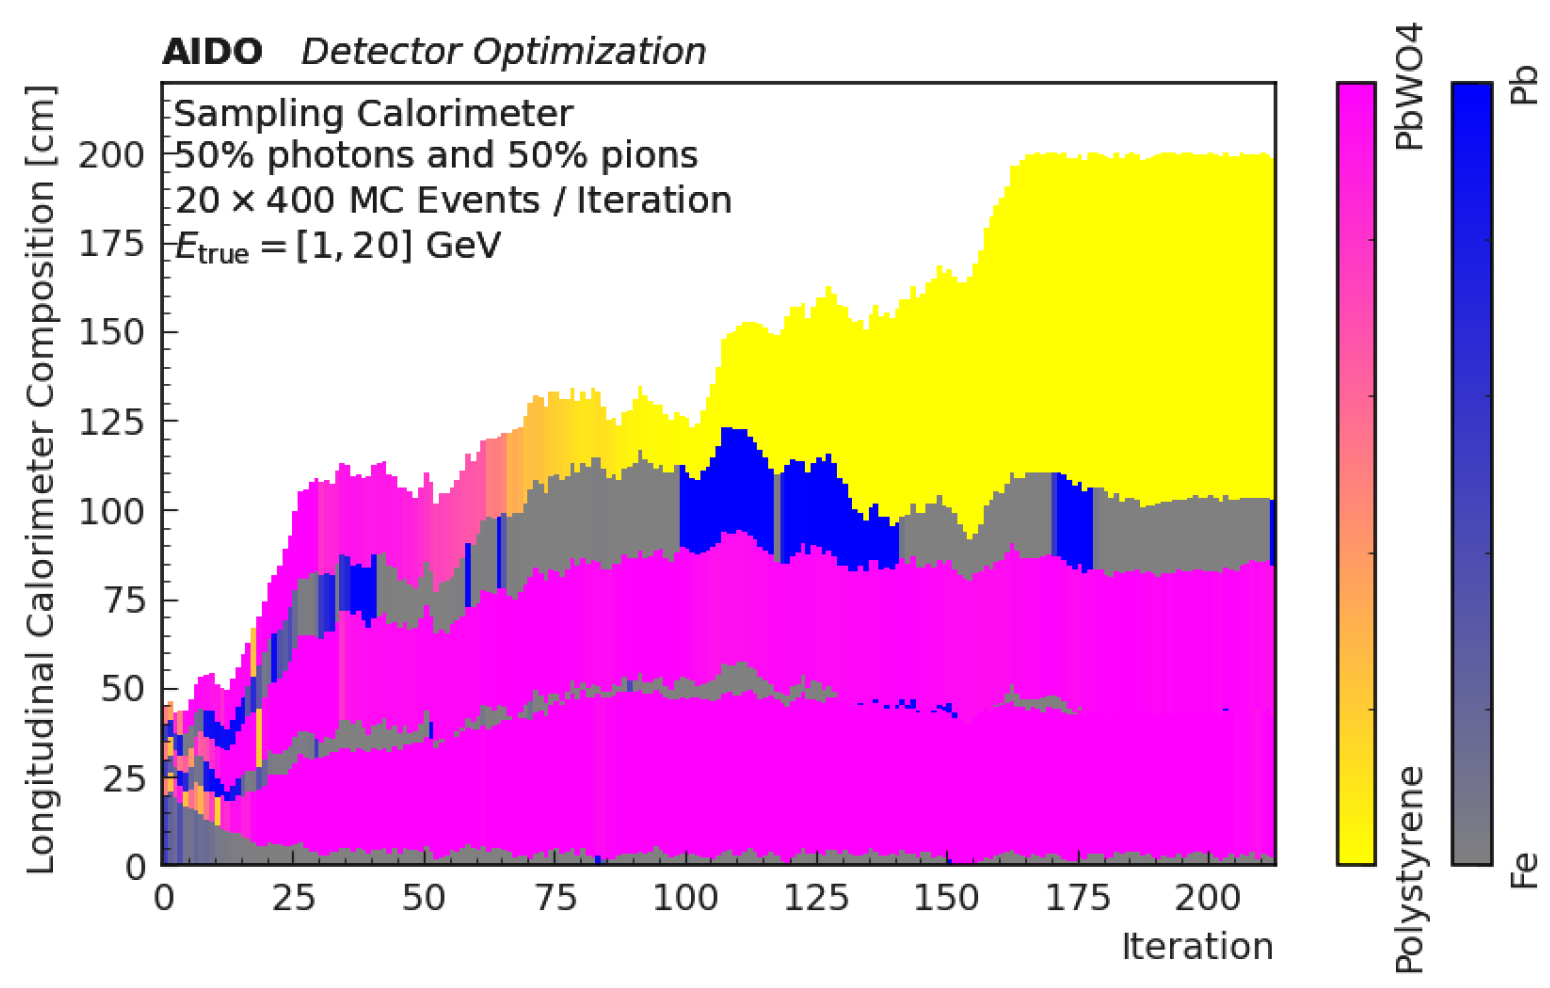
Hey AI, Design A Calorimeter For Me

As artificial intelligence tools continue to evolve and improve their performance on more and more...

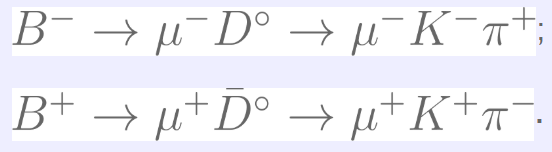
The Multi-Muon Analysis - A Recollection

As part of the celebrations for 20 years of blogging, I am re-posting articles that in some way...

User picture.
picture for Hank Campbellpicture for Heidi Hendersonpicture for Bente Lilja Byepicture for Sascha Vongehrpicture for Patrick Lockerbypicture for Johannes Koelman
Tommaso DorigoRSS Feed of this column.

Tommaso Dorigo is an experimental particle physicist, who works for the INFN at the University of Padova, and collaborates with the CMS and the SWGO experiments. He is the president of the Read More »

Blogroll
Note: updated list of links at the bottom.

(Older Note:
Bet on this signal! See at the bottom of the article! Odds are two to one in your favour now!)

(Older note
: Update at the bottom.)

It seems I am late on this one -an internal note by the Atlas collaboration seems to contain the discovery of a bump in the diphoton mass distribution from data collected in 2010 and 2011. They find a signal that seems consistent, in mass and resolution, with what one would expect from a Higgs decay, if the Higgs were sitting at 115 GeV, the value at which LEP II found some hint (a 1.7 standard deviation signal) before being shut down in 2001.
That's because you never learn anything new.

[By the way: if you were coming here to learn the solution of my riddle about the mysterious plot I posted here yesterday, be patient - I will publish an answer tomorrow on that issue.]
After the disturbance created by the Higgs rumour in ATLAS, I think we can go back to normal business - in this case, keeping my word on discussing things that were left hanging.

Your response to my small riddle was quite good, forcing me to provide a timely and exhaustive explanation of what is in the plot I posted a few days ago.
A picture is worth a thousand words. This is true both for photographs and for graphs, but sometimes the words are spoken to the wrong ears. I would like to offer you a very simple, visual test today: show you a picture and let you guess what it represents. Depending on the response, this might end in oblivion or be tried again with another subject.

So the question is: what does the picture below represent ?


A few hints:

- I did the graph myself, and it took me 10' of programming and a tenth of a second of CPU on my laptop.
A casual look at the Arxiv hep-ph listings this morning was enough to confirm that the feeding frenzy of theoreticians around the latest bait thrown in the waters by CDF is not showing any sign of slowing down.

The paper in question is 1104.2893, and it discusses "Weak-triplet, color-octet scalars and the CDF dijet excess". In their model, the authors (B. Dobrescu and G. Krnjaic) argue in favour of an extension of the standard model which includes rthree new coloured particles, two charged and one neutral state.
The Xenon 100 collaboration has finally released the results of their data analysis, and the results are saying that there is no Dark Matter in sight so far. Since we live in an age where time is precious, I think many of you are only interested in the bottomline. I can give it to you straight away, in the form of the plot which summarizes the results.

Xenon 100 finds three events compatible with a dark matter signal, with a background expected from more mundane sources amounting to 1.8+-0.6 events. The limit they extract on the cross section versus mass of the hypothetical particle are shown below by a thick blue curve, which cuts into the flesh of the preferred parameter space of constrained minimal supersymmetric theories (in grey), pushing them farther away.