This is an update to my articles Arctic Ice June 2010 and Arctic Ice June 2010 - Update, part of my ongoing series of articles about the Arctic.
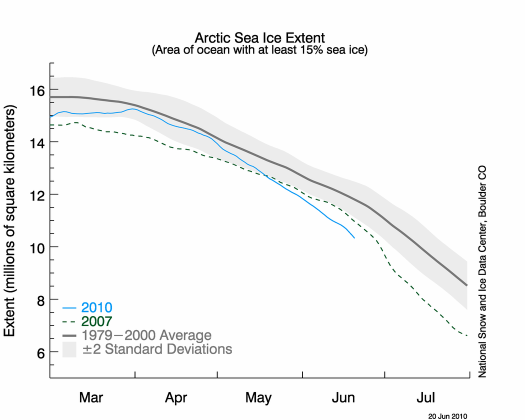
The NSIDC ice extent graph continues to show ice extent well below the 2007 levels.

Reduced size image. Source: http://nsidc.org/arcticseaicenews/
It is not widely remembered today, but the most rapid and unusual ice loss in 2007 didn't begin until about July. This year's ice loss didn't start to show up in graphs until the end of April, leading some bloggers to write about ice recovery and near-normal extent.
The rapid ice melt this year began at the end of March, accelerated in late April and continues at about the same rate. The melt extent is already ahead of 2007. Considering that melt in 2007 didn't really begin to take off until the 4th week in June, we must expect that by the last day of June the ice extent will be dramatically below 2007 levels.
There is always going to be a problem in using computerised measures of ice extent, area, volume and such. It takes a human eye to see the difference in quality of sea ice in different areas. To reiterate what I have said before: I regard the mechanical qualities and mobility of ice as being paramount in predicting ice melt. Ice which lacks mechanical strength is readily fragmented by melt or impact. Fragmented ice is highly mobile and is susceptible to the vagaries of wind and current.
In my update of June 8 2010 I wrote:
The ice loss in the general area of the Bering Strait has been slow to average for the season. From the Kara Sea to Amundsen Gulf the main pack is separating from, or already separated from the shorebound ice. I predict that this ice loss will accelerate as highly fragmented young ice, and ice with surface meltwater, disintegrate rapidly.That acceleration happened. The area is even more fragmented and mobile.
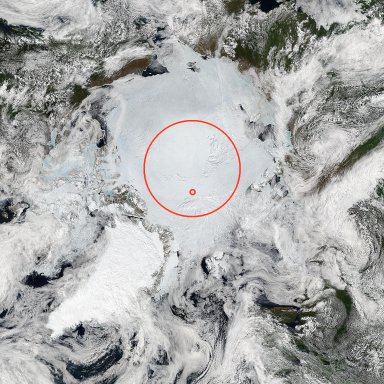
In my most recent instalment of MODIS Rapidfire For Citizen Scientists I have tried to show some tricks - yes, tricks - for drawing the eye's attention to areas of sea ice worth a closer look. Actually, ice color is a fairly good indicator of ice condition if the image resolution integrates polynyas and meltwater pools so as to make the ice look bluish-grey. The image below shows whiter ice within the circle and bluish ice outside of it. The Arctic mosaic images show the bluish-grey areas as highly fragmented, mobile and melting ice. That rotten ice probably won't last long. I give it 4 to 6 weeks.

Area of maximum ice quality - June 19 2010
Source image:
http://rapidfire.sci.gsfc.nasa.gov/subsets/?mosaic=Arctic.2010170.aqua.4km
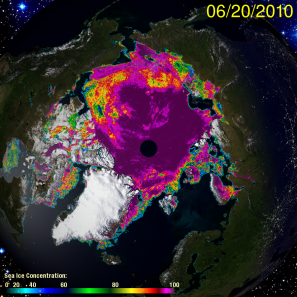
I suggest that you have a look at some of that rotten ice in the Rapidfire images and then compare what you see with the following Cryosphere Today image.

Image source: http://arctic.atmos.uiuc.edu/cryosphere/
Full size image: http://arctic.atmos.uiuc.edu/cryosphere/NEWIMAGES/arctic.seaice.color.00...
Today is the summer solstice. In the Arctic regions, peak temperatures lag the solstice by an amount which varies up to about three weeks. The Arctic hasn't fully warmed up yet.
A prediction:
By July 1st, much of the ice which shows as blue, green and yellow in the above image will have melted. The NSIDC graph will show ice extent continuing below the 2007 level.
Reference materials:
A list of interesting websites for Arctic-watchers, compiled by Neven.


Comments