


We always want to think about air quality but the paper has two problems. First is that two of the pollutants they worry about are not known to be pollutants at all. PM2.5 and even smaller PM1 are so minute you need an electron microscope to detect them, but since the 1990s air pollution activists have sought to include that with a real carcinogen, the PM10 that is actual smog. The second issue is that the pollutants are only estimates.
So they are running models using estimates and seeking to impact policy. Simulations can be useful but even experts in the private sector can't make great models using a lot of variables, and academics surely will not in almost all cases.
Why this is not holding up
The authors use two air pollutants, actual smog (PM10), and nitrogen dioxide (NO2), but lumping them in with virtual pollution that lacks weight of evidence makes it look like an attempt to bolster weak association, and the fact that those two pollutants are also only estimates is even more suspect.
PM1 isn't accepted by scientists as being anything meaningful, it is basically dismissed as the pre-diabetes of the air quality community; a way to get Americans worrying and spending money on something, from cars to air filters, with no benefit except to trial lawyers looking for new things to sue over. PM2.5 is no better but since all PM10 can logically include small micron particulate matter they say the smaller must be as harmful as the larger. Instead of 'the dose makes the poison' people who contend PM2.5 is the same as PM10 believe any dose is a poison.
That is not science, it is homeopathy.
The world has gotten fatter while air has gotten cleaner
Ignoring the science, they associate pollution, some real and some hypothetical, to lifestyle-caused fatty liver disease. The big problem with that is that actual pollution has gone down as non-alcoholic fatty liver disease has gone up. Pollution has gone down a lot.
Using virtual pollution, air can look a little unclean, but not harmful.
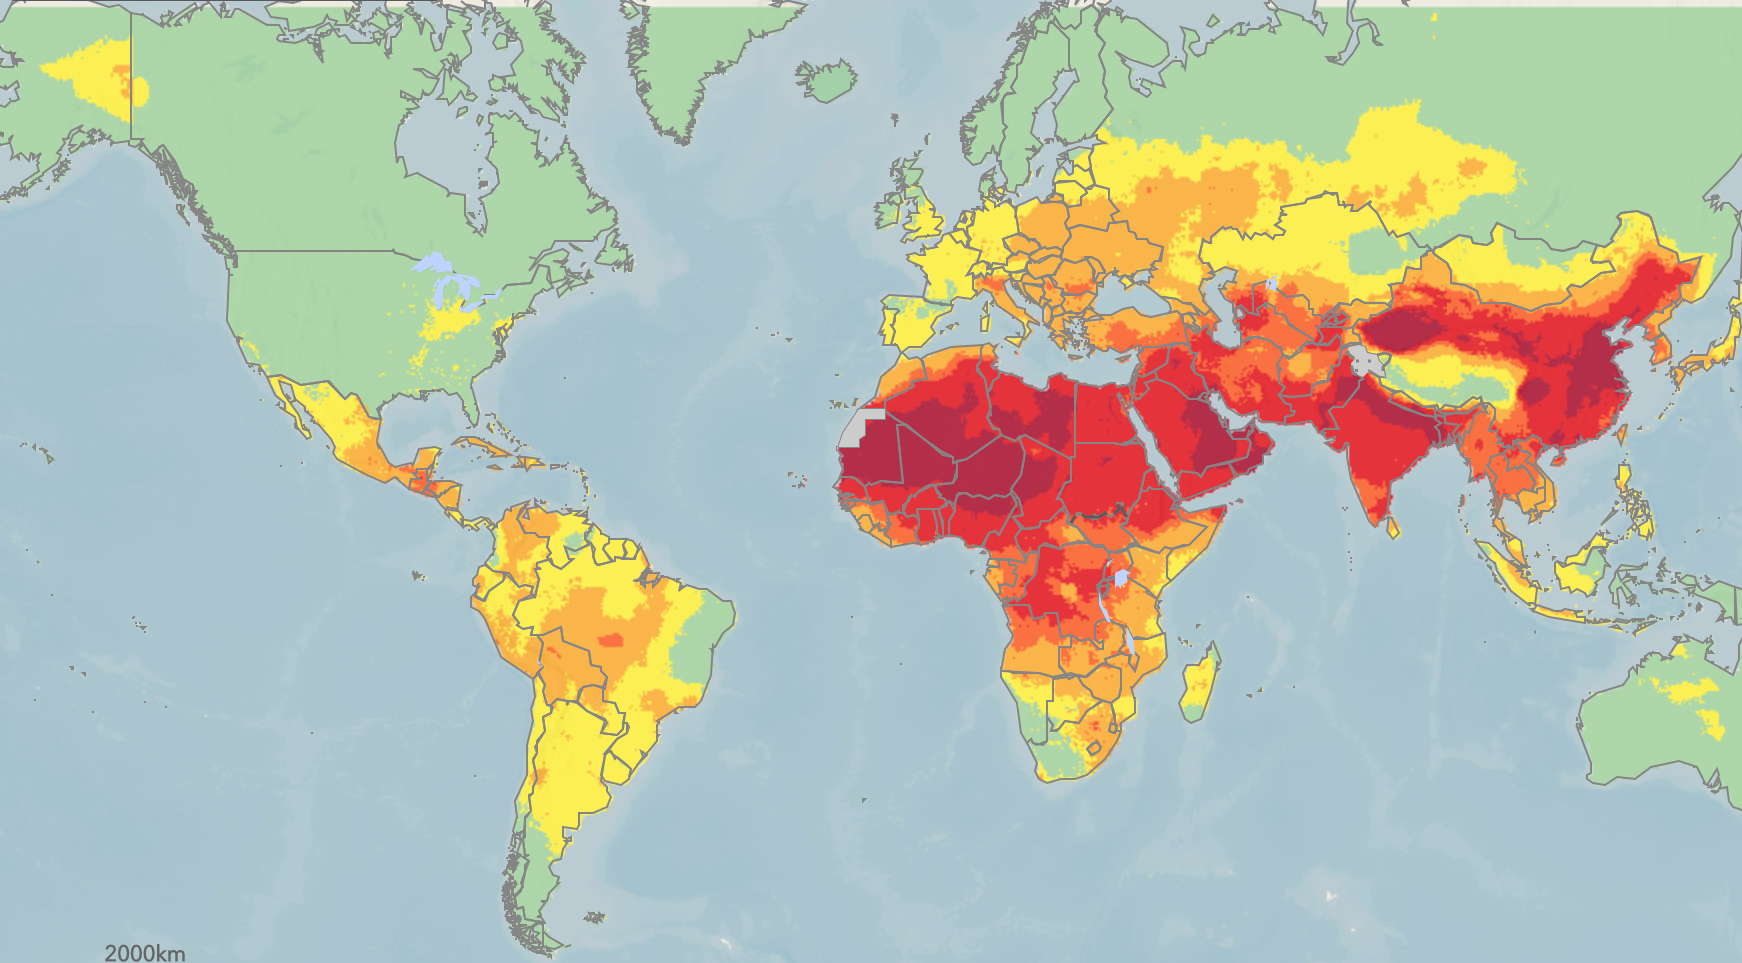
Source: WHO
Yet those red and orange weather maps are done using a statistical trick. They make a graph that only starts with slightly dirty air, the same way if I ask you to rate how brilliant I am on a scale of 9 to 10.
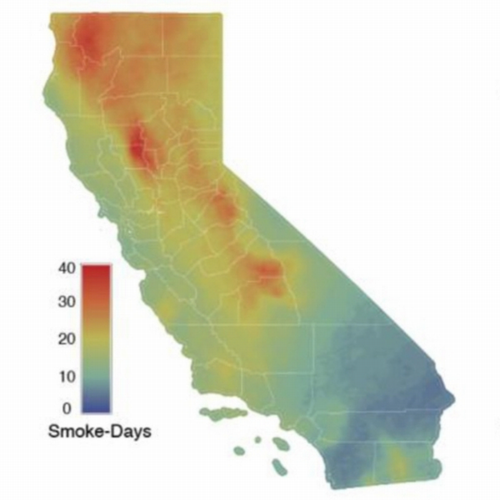
By changing the colors on the chart California air which looks like this
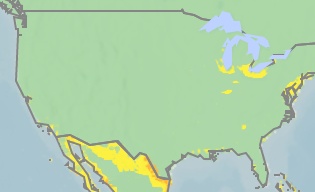
Can appear like this.
It's fraud. But since PM2.5 and the even more ridiculous PM1 are so tiny, every map of nearly every place in the world can look harmful - by simply claiming levels of those are red colored.
50 years ago real pollution was common but now only the Los Angeles basin, where it is impossible not to have smog, is truly polluted in the US as a common event. It is so geographically prone to pollution that even removing most of the cars during the pandemic caused 157 bad air days in LA. 157. Nearly half the year are now bad air days, as long as you define pollution down. Next up the state is banning lawnmowers.
Defining pollution down, it is clearly now about politics rather than air quality, is part of the reason why activists pivoted to PM2.5 - as a bonus it gives TV weather talking heads a red and orange map to throw up for viewers.
So pollution has gone down while obesity has gone up - and lifestyle diseases related to it. The risk of all obesity related diseases has increased since the 1980s, when agriculture defied Population Bomb hysteria and entered a Golden Age. As I note when I give talks, farmers now produce more food on less land with less environmental strain than ever believed possible. A science win so outstanding that for the first time ever poor people can get as fat as only wealthy elites once could. When people can get fat, they will. Food that tastes good will mean over-indulgence by some and even young people of today, Millennials and Generation Z, are heavier on average than any generation has have ever been.
So by defining pollution down, ignoring real smog and focusing on invisible particles, and claiming virtual pollution has gone up, while obesity and non-alcoholic fatty liver disease has gone up, gives you two curves going the same way.
When you have two curves going up, it is easy to correlate them. A whole website is even devoted to ridiculing spurious correlations that can all be epidemiology papers. Here are two curves going up.
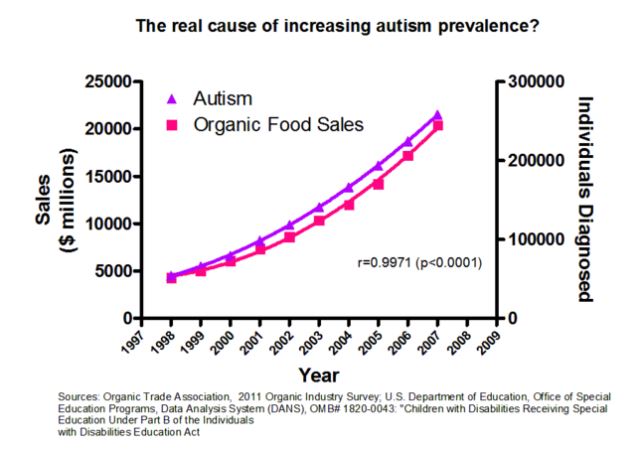
The ability to correlate anything to anything because we can detect anything in anything is why epidemiology papers need to have a giant red EXPLORATORY on every page. That would remind journalists this is not science, it is only a correlation, and would need a science foundation for it to be actionable.
Instead, a confusing mishmash of competing correlations promoted by media outlets seeking traffic and ad dollars, all claiming statistical significance, is why there is doubt about COVID-19. Epidemiologists at places like Harvard School of Public Health and inside IARC have undermined real science for decades, the public has been taught not to trust correlation because wine doesn't prevent cancer and BPA doesn't cause it, despite epidemiologists trying to claim both.
The next plague is coming. I wrote about it in 2017. This was the third coronavirus pandemic in 17 years. If we want epidemiologists to be trusted next time, they need to call out more bad papers in their tribe, and not just call them out when someone on the other side of the political aisle embraces them.


Comments