

The appearance of electron neutrinos in a muon neutrino beam is a very important oscillation signal of neutrinos, that allows the measurement of the parameter theta_13, one of the so far less-well known parameter of the neutrino mixing matrix.
15 years have passed since the first experimental evidence, performed again by SuperKamiokande, of neutrino oscillation phenomenon, a quite new and startling process which is still the only observation to have caused a revision of the standard model of particle physics so far. In the course of the last decade many experiments have measured oscillation parameters, using neutrinos from the sun, from cosmic ray interactions with the earth, from nuclear reactions in reactor facilities, and from accelerator-generated neutrino beams. We now have a rather clear picture of the value of these parameters, but critical information is still missing which may allow us to infer the nature of the mass hierarchy of the three neutrino types, and the CP asymmetry they may exhibit.
The T2K experiment has collected data with its near and far detector in the course of the last three years, specifically from January 2010 to June 2012. The experiment was the first to measure theta_13 to be different from zero using data collected until 2011, and has now updated the measurement using the 2012 data and improving their analysis methods.
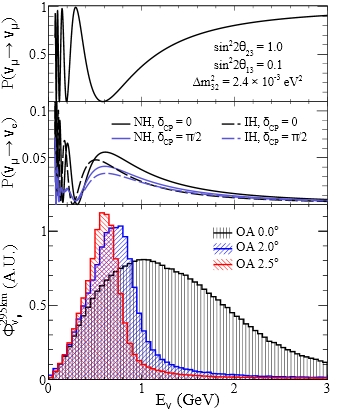 The far detector of T2K is ideally placed for a measurement of the appearance of electron neutrinos in a muon neutrino beam, as shown in the figure on the right. There, one can see on the top panel the probability that a muon neutrino will be seen as a muon neutrino at the far detector, as a function of its energy. On the middle panel one sees the probability that the muon neutrino will be seen as an electron neutrino instead. The bottom panel shows the energy spectrum of the produced neutrinos at different angles to the beam axis, evidencing how the bulk of the neutrinos are in the right energy range to maximize the appearance of electron neutrinos in SuperKamiokande. Different values of still unconstrained parameters modify slightly the probability curves, but they do not affect the general picture much.
T2K analyzes the beam properties at a near site where oscillations effects are negligible, in order to have a precise estimate of the flux of neutrinos in the far detector. The number of studies and their depth prevent me from producing a meaningful picture here - their paper is 42 pages long and I am no expert of this kind of experimental techniques. However, the impression I get from browsing the article is that they did a very careful job, such that their systematic uncertainties are really under control.
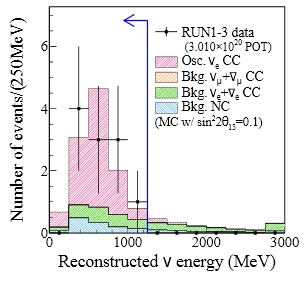 In the end, the measurement is just a counting of the very few clean electron-like candidate events they collect in the SuperKamiokande tank: 11 such events are observed (the previous publication reported six of these), when backgrounds (equally shared between charged-current electron neutrino and antineutrinos, and neutral-current events) are estimated at 3.4+-0.4. A simple calculation shows that there is a less than 0.1% probability to observe 11 or more events when 3.4+-0.4 are expected, so the effect is now a more-than-three-sigma one: a firm evidence of the oscillation phenomenon, that is.
The figure on the left above shows the energy spectrum of the candidates and of predicted backgrounds: this, as well as other distributions, demonstrate that the characteristics of the observed signal are as predicted. The article also shows figures which are important in this field of research, traditionally being the place where to look for smoking gun effects of nasty backgrounds: the distribution of the vertex location of the reconstructed neutrino interactions.
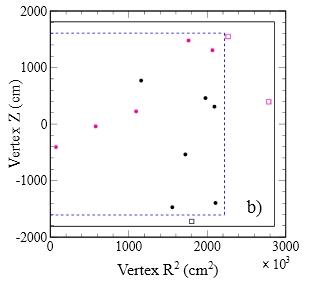 The figure on the right is a "R^2-Z" view of the SuperKamiokande tank, with points where the electron neutrino events were seen. The dashed lines highlight the fiducial volume where events are accepted: although most events are found at large values of R^2, there is no ground to speculate that these events can be anything related to the specific location in the tank.
Instead, the x versus z view (which is like looking at the big SK tank from above) shows a different picture. Here (see below, left) the beam arrives from the top left, as indicated by an arrow. The 11 events here scatter a bit more oddly: not only a few of them are seen at the limit of the fiducial region more clearly here, one notices that all of them have negative x coordinate !
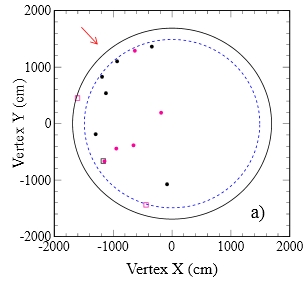 Is that observation worth considering ? I doubt it. Please consider: first of all, there is no specific value in the direction of the x coordinate, which is only partly correlated with the beam direction. Second, we are observing the data ex-post, and making speculations on their distribution in two 2-dimensional graphs. I could imagine at the very least eight just-as-funny halves of the SK tank where the data could have all landed, causing a similar raise of our eyebrows. E.g., the negative and positive x, the negative and positive y, the lower and upper z, and the lower and upper halves of the R^2 range (there would be quite a number of additional "funny distributions" one could consider, however).
Now, the probability that having observed 11 events they all lie in the same half of the detector, as defined above, is simple to compute. Let us consider the negative-x half alone for the time being: the odds that all 11 end up there are one in 2^11, or 1/2048. But equally surprising would have been to see all of them appearing in the positive-x, or in any other of the 8 halves we have defined above. So the "global probability" of this asymmetry in the vertex distribution is 8x1/2048 = 1/256, or 0.4%. Strictly speaking, it does not pass the "three-sigma" level to be evidence of something weird in the data!
Of course I know that many of my colleagues could take a different stand on this issue. Similar discussions last forever: one may cling to the very odd clustering of events near the entry point of the beam (the top left part of the xy view above); or one may argue that if one has observed an excess whose p-value is 0.0009, but observes an oddity in the data (which could point of some pathology of the excess) at the level of .004, this is not altogether very convincing. Maybe this time we can get away with noting that the value of the theta_13 parameter that can be extracted from the observed excess is perfectly compatible with independent estimates obtained recently from Daya Bay reactor neutrino experiment and others: if one argues ex-post, after all, why not using other ex-post information to counter-argue ?
No, I can hear somebody argue - that is not legal; we cannot give credit to an experimental observation only because it conforms to previous ones!
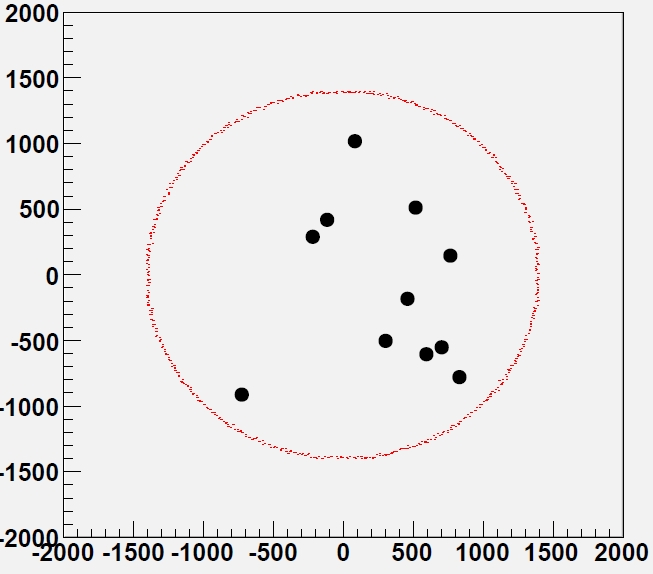
Fine then. Since I like the direct approach to these kinds of problems, I decided to do what once none less than Luis Alvarez mentioned in his 1967 Nobel lecture (the program GAME, which generated fake mass distributions where colleagues were asked to spot a invariant-mass peak... see the lecture here). I thus performed a simulation of the xy location of 11 random vertices in a graph like the xy one shown above. I ran 100 11-event sets, and picked up the three which looked the most odd I could find in the set. Of course, that is my personal judgement at work. Our brains love to find patterns, and there's quite a few interesting patterns one can construct with 11 points in a circle!
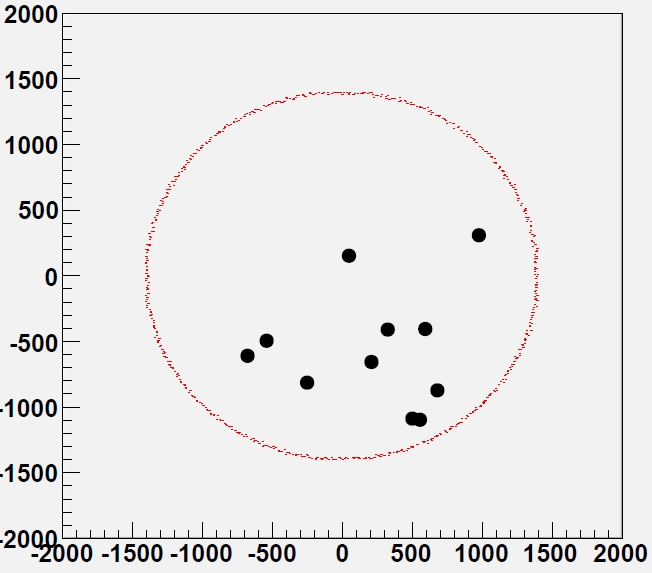
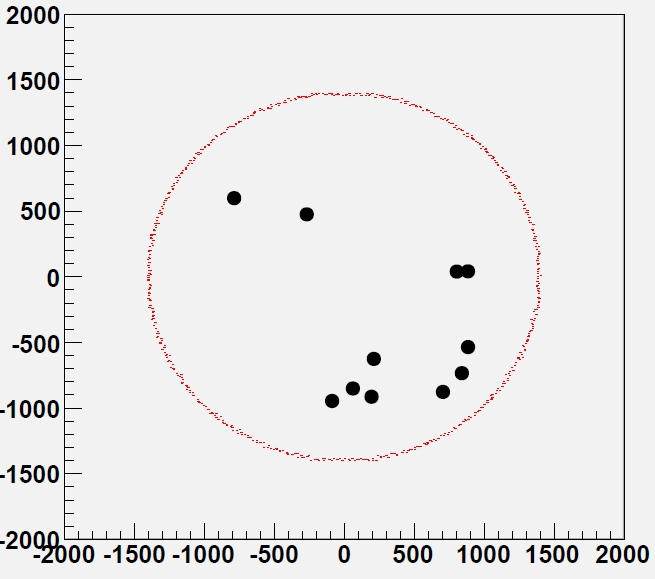
Now judge by yourself. Would you be more surprised to see one of the three distributions shown below, or the real one shown above ? Be honest !
Distribution 1:
Distribution 2:
Distribution 3:

Comments