

What is more, I could find the corresponding picture by ATLAS: the comparison shows an additional interesting datum -the relative collection efficiency of the two apparata. Now, to be fair, I believe the figures cannot be directly compared, at least as far as the low-mass region is concerned: the ATLAS figure only includes data collected by their high-Pt muon trigger, while I believe that the CMS figure includes also lower-Pt muon triggers. In other words, the CMS figure is expected to contain more low-mass resonances than the ATLAS one. Still, the comparison is quite interesting.
Here is the CMS figure: entries per bin are normalized to counts per 1 GeV (the same as is done for the ATLAS plot following below).
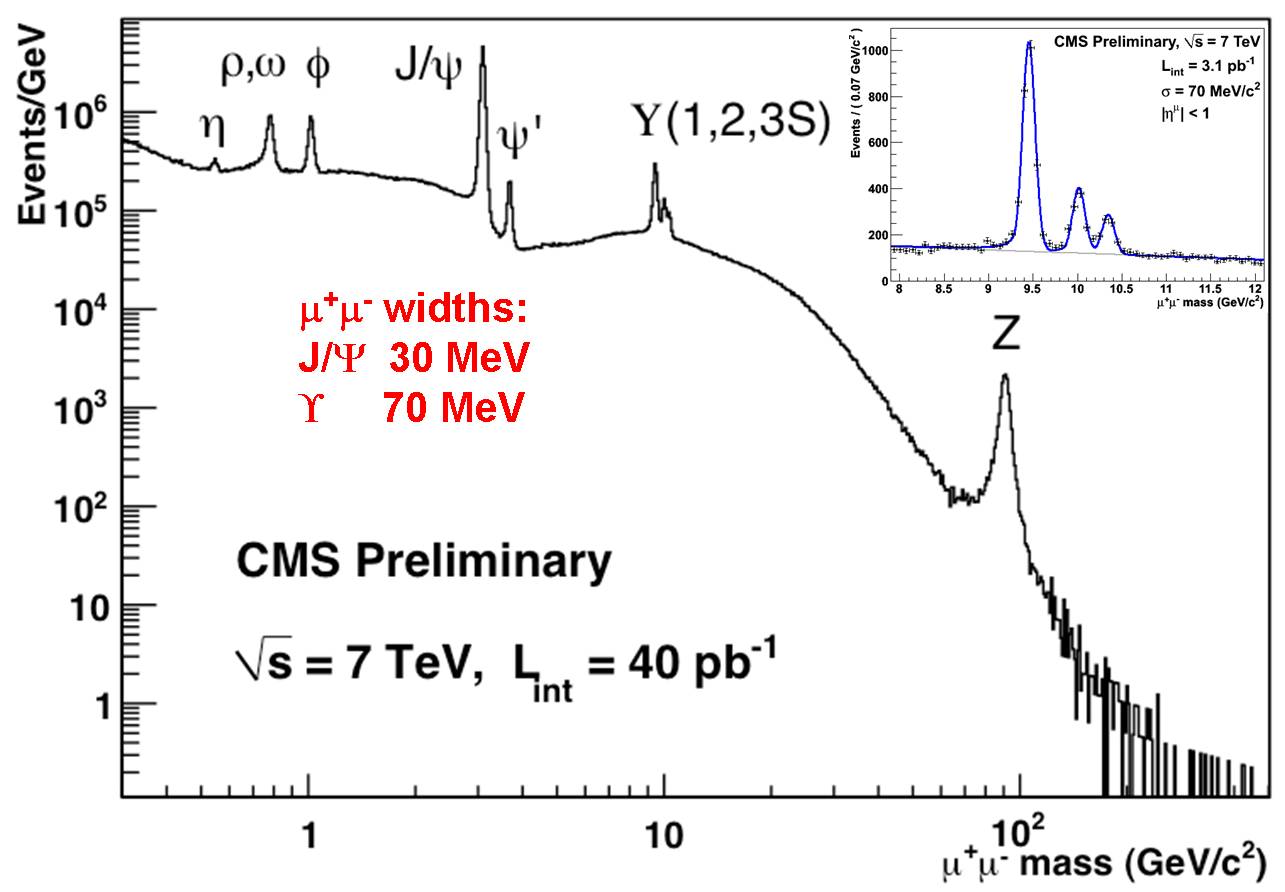
And here is the ATLAS figure. As you immediately notice, the number of Z events is quite similar in the two graphs, but the lower resonances are much more numerous in the CMS plot. For instance, the upper plot has a peak of the particle labeled "J/Psi" (the famous charmonium state, discovered in 1974) which gets to 5 million entries per GeV, while in ATLAS they get only 100,000 per GeV. And the lower-energy resonances are much less distinguishable below -the particle labeled "eta" (
 ) does not even appear. As I said, it is due to the trigger. But still, it is not by chance that the "M" in CMS stands for "Muon"! 1-0 for CMS as far as dimuon resonances go!
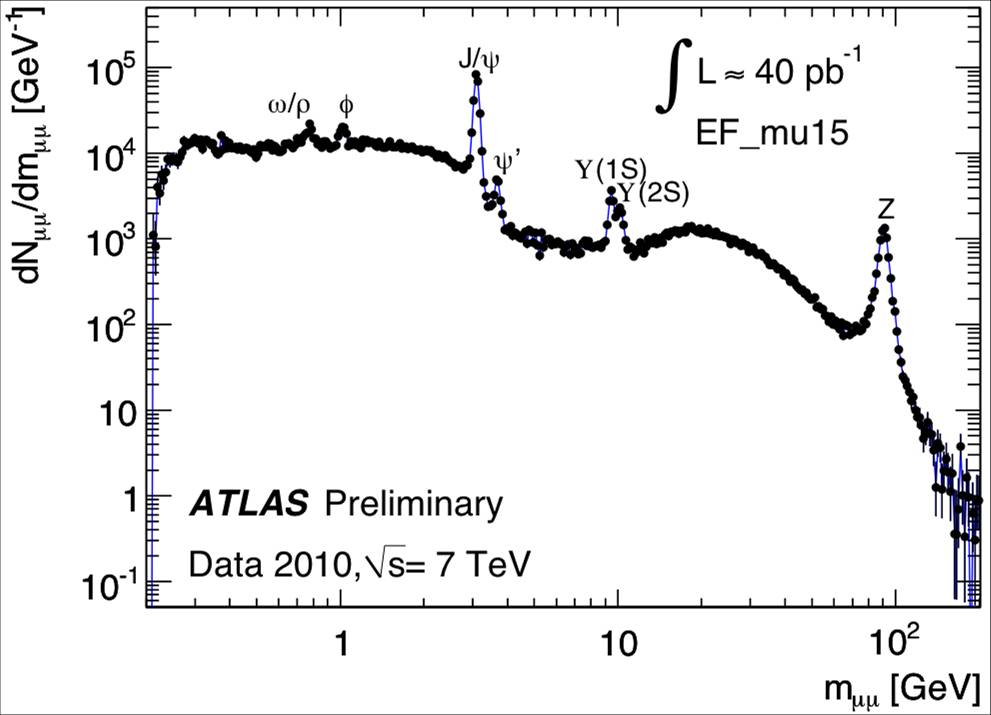
I think these graphs are terrific in their capability to convey a particle physicists' awe at the subatomic world. These particles are not just coming out of our imagination -they are as real as bread and butter!

Comments