

The signal of that fancy baryon, according to the DZERO collaboration, exceeds the significance of "five standard deviations", the coveted goal above which a new particle is certified to have been unequivocally observed. A signal is said to have a significance of 5-sigma when the probability that it arose by chance is less than one in a few millions.
 I took the pains to check the calculation hinted at on the scientific paper where the discovery is claimed, which was sent to the Arxiv and then appeared a few months ago on the prestigious Physical Review Letters. I found that the significance appears to be indeed above 5-sigma if computed as per DZERO's recipe, although barely so, and smaller than what DZERO computes.
 I think DZERO forgot a factor of two in their calculation, but mine is a speculation. Whether my correction of the DZERO result is wrong, or whether I am right instead, is still arguable -I have not gotten any reaction from authors of the article yet (but indeed, they might just not have seen my article here, or they might be ignoring me on purpose).
I would like to stress here that the motivation for checking that significance calculation lies entirely on my wish to give examples to you, dear readers, of the subtleties that hide behind the scenes of cutting-edge research in high-energy physics. I of course have no ambition to "correct" a large collaboration of half a thousand brilliant minds -although I happen to know that mistakes can and do occur even within such extraordinary gatherings.
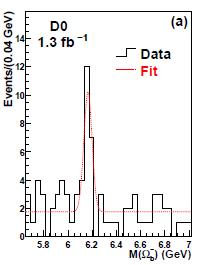 A point I made in the former post on the Omega_b discovery was that a five-sigma signal is really a significant one, one that stands out so clearly from backgrounds that the exact calculation of significance, so to speak, becomes automatically irrelevant: "that is a resonance, for sure". The signal is of the "in-your-face" sort. The DZERO peak of Omega_b candidates, shown on the left, does not give me that feeling.
 By eye, I estimated it looked like a less than "observation-level" signal, although not by much. Above four standard deviations, for sure; but probably below five. Please wipe that grin off your face: experience tells. Show a hundred five-sigma signals to your aunt, and she earns the capability to make such a call herself.
The question of the real significance of the Omega_b signal is of sufficient relevance to deserve a more careful approach. In the former post I computed 5.05 standard deviations using DZERO's method -just a simple formula converting the likelihood difference into a probability, and from that to a tail of a Gaussian distribution. That method is a slightly optimistic one in cases when probabilities of the order of one-in-ten-millions are computed: in this post I will use the more straightforward number-crunching method, which is based on pseudoexperiments.
A pseudo-DZERO-experiment in our case consists in filling a mass distribution like the Omega_b histogram in the DZERO paper with 79 entries sampled according to a flat distribution, trying then to find out whether a Gaussian signal can be fit somewhere in the spectrum.
(Actually, a more correct procedure consists in varying the number of entries for each pseudoexperiment: in the data DZERO finds 79 events, but that only means that in general, a number "close" to 79 will be found. If they re-did the experiment, they might find 70, or 83, or 77: the function describing how 79 varies is called "Poisson distribution", and it is quite similar to a Gaussian of average 79 entries and width 8.9 entries. In my check, I did pick at random a number from a P(79) distribution, since I am such a perfectionist.)
It is quite easy to write down a program that fills a pseudo-histogram, fits it with a flat background alone, stores the value of likelihood of the fit, and then tries to fit the same histogram with a background plus signal hypothesis. The difference between the likelihood of the two fits can be converted in a significance, as I explained in the former installment of this discussion.
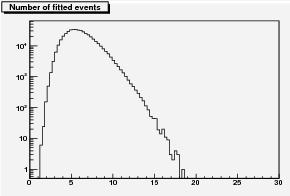
Since computers are made to run, we can let them do precisely that. Once we know how to do a pseudoexperiment, it is a trivial matter to do a gazillion of them. What we get is a picture of the whole probability distribution of the number of signal events, and of significance, that we might find in a DZERO-like histogram. From those, we get to know whether the 17.8 signal event bump found by DZERO is really something that happens only 8 times every hundred-millions, or more frequently so.
Now, I would not want you to believe that this check is a matter of a minute. In fact, generating a million pseudoexperiments and performing two fits on each of them takes about six hours on my computer. I so far did 500,000 only, but the results are already interesting enough to feel I can share them with you.
 Remember: the signal published by DZERO amounts to 17.8 events, and the probability of such an occurrence, computed with the delta-likelihood method, is of the order of one in a few millions (DZERO says one every twelve millions, I found one every 2.5 millions). That is barely five standard deviations. So, in a 500,000 set of pseudoexperiments, we expect to be lucky if we find one showing a signal larger than 17.8 events. How many did I find ?
I found one. A bit more than 18 events, and a computed significance of little less than 5-sigma. While this might be a fluctuation, the distribution shown in the graph above tells you that one in 500,000 does not look quite like a lucky chance: the distribution does die out as the number of fitted signal events reaches 17 or so, but not so quickly as the probability estimates discussed above would imply.
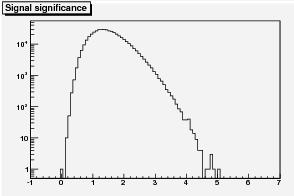 The significance distribution also shows a similar behavior (See left). Here, a peak at zero is due to the fact that I constrained the signal to be above zero entries -mimicking the experimenter's practice of considering only positive bumps as a hint of signal. The tail, however, shows the characteristic parabolic behavior -a parabola, on a logarithmic plot, is in fact a Gaussian!
 And, needless to say: the experiment with 18 fitted signal events is one of the few that belong to the bins on the far right of this distribution, at about 4.8 sigma significance. Things add up nicely, it seems: 4.8 standard deviations do correspond to a 1-in-500,000 chance.
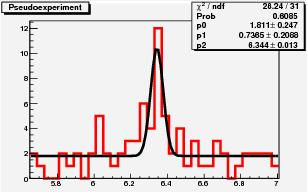
Finally, it is useful to show how the histogram with the largest signal among the 500,000 pseudoexperiments looks like. It is shown below. A clear bump, to be sure, but is it a five-sigma one ? The answer is no: it is slightly below that value. One expects to find such a fluctuation in a background-only distribution of 79 events, once in 500,000 times.
 My computer is running tonight - I plan to update this post with the result of a 2-million test. Maybe if I get four results above 17.8 events I will be able to convince you that DZERO's find is not an observation yet!
"Why bother", you might ask. Indeed, I do believe that the Omega_b baryon exists. So this whole business of nit-picking on a beautiful new find by a respected particle physics experiment might look childish. However, while the signal found by DZERO has all reasons to be trusted, only time will tell if it has really the properties that DZERO measured... And maybe not so much time after all!


Comments