

The idea of using anomaly detection tools for new physics searches is by no means new. Indeed, while we have a pretty good hunch of how to look for Supersymmetry or Hidden Valleys or Colorons or whatchamacallits - all but one of the named things are new physics theories - we are also ready to admit that new physical phenomena that are not predicted by the Standard Model of particle physics might just be something else. Why, that's what is actually fun of being a particle physicist: we look for the unknown unknowns. Sorry, Donald Rumsfeld, you retired but we get to keep doing it. Indeed, many have attempted to look for new physics with fishing expeditions that did not specify a new physics model.
The problem, though, is that finding unknown unknowns is f***ing hard. Not only are LHC data inhumanly complex, and making sense of them is a years-long job for thousands of physicists. Finding something that you have no idea how it looks like, amidst a jungle of other things whose features you only have a vague idea how should behave, is a bizarre nutjob.
But fear not. Enter Machine Learning. The task of finding anomalies in data is something that many of us label as "unsuperviserd learning", and which I could more or less describe as such: a machine is left alone with the data over the weekend, and upon coming back to work on Monday you find it with its feet crossed on your desk and a cigar in its mouth, waiting to show you the solution. In other cases, one prefers to talk about "semi-supervised learning", where the algorithm pesters you with whatsup mesages while you're at Sunday mass, asking for clues on what the normal data should look like. If you ask me, I prefer the unsupervised version.
[I should note that ML guru Yann LeCun nowadays speaks of "self-supervised learning" as the most pristine form of learning, not by accident.]
As I went on vacation for a dozen days to an exotic location over Easter, I finally had some time to write code (yes, my "research" job is dominated by non-research errands...). And since I happened to have an idea for a new super-duper Anomaly Detection algorithm, nothing could keep me from putting some c++ code together. The result is something I will call here, with an old-fashioned six-capitals-naming-convention reminiscent of good ole Fortran days, RANBOX, although I am renowned to be pretty lousy at choosing algorithm names.
What RANBOX does is pretty much what I described in the previous article. Since I like to think at particle physics applications, I will use physics jargon below, but you should keep in mind that the application could be just as good at finding defective pieces in an automated production chain as at finding new physics signals in LHC data.
You take some high-dimensional data, each event (a proton-proton collision) being composed by a list of observed variables. Okay, my Statistician friends, let's call them "features". Each feature represents something you measured in the detector. A proton-proton collision event is a pretty darn complex thing: millions of electronic signals comprise its observed footprint, and thousands of meaningful "high-level features" can be cooked up by reconstructing particle trajectories and energies for each event.
Since the data live in multi-D, you can imagine the question "is something unexpected going on" to be a very, very hard one to answer. In principle you believe that the Standard Model is correct: the collisions only produce particles that we know of, at rates we can precisely predict. But there are, indeed, uncertainties. What we cannot predict, we model - but in so doing, we lose our ability to have a perfectly clear idea of what we should see if no new physics is there.
If we had that, the problem could be semi-supervised: whatever is at odds with the perfectly well-understood and perfectly well-defined picture is new physics. Alas, we're not there.
So let's indeed be non-supervised. Enter RANBOX. What RANBOX does is to take the multi-dimensional data and apply a transformation to each of the features, such that it becomes featureless! Indeed, if you have a distribution - say a Gaussian , or whatever else you feel like thinking of, as long as it is a proper, normalized density function - then you can construct the Cumulative function of the distribution. If f(t) is the distribution, the Cumulative is defined as
The above function is a map, which allows you to estimate the integral of the original function up to x. The nice thing about F(x) is that, once f(t) is normalized to unity, F allows you to convert any value of the variable that distributes according to f(t) into a value that takes on values only from zero to one. In other words, F(x) has values in [0,1]. If you use F(x) as a substitute for your original variable x, i.e. x'=F(x), then x' has very nice properties: it is defined in the compact support [0,1], AND it has a flat density distribution. In other words, there are no peaks, no wiggles, no nothing: x' is flat.
So now, if an event is specified by measuring a certain number of features -say 50, a reasonable number that includes all the leading jet energies and angles, the energy and direction of electrons and muons, the missing energy, etcetera - you can transform them as above, obtaining your data in the form of a conveniently sized hypercube of unit side!
A cube of unit side? Where has all the information gone then, the precious information which characterizes the event and the subtle correlations between all those features? No worry: those correlations are still there, but they are invisible if you look at one variable at a time. Every variable, if plotted unconditional of the value of others, is perfectly flat in the new metric. But overdensities and underdensities inside that unit multi-D cube still tell us what the events look like - what the underlying physics that generated it is, in other words.
Now, RANBOX does something funny. Instead of proceeding to study the density inside this cube, it chooses at random a subset of features - say 5 or 6 - among the 50 that characterize the data. Why? Because a fifty-dimensional space is a very complicated thing to study. By only looking at some of the features at a time, you can learn stuff but avoid being overwhelmed by the complexity.
Once those, say 6, dimensions are randomly chosen, the algorithm chooses an interval for each, in the [0,1] range. That means throwing two more random numbers x and y, constructing the interval [x,y]. This is done for each of those six dimensions. The procedure defines a random hyperbox inside the hypercube. If the data were completely uniform in the cube, this hyperbox would contain a fraction of the data that could be estimated as the box volume: say your cube contains 1000 events, and the box has volume 0.005 -> you expect five events in the box!
Any random box will contain a number of events that departs from the "uniform hypothesis" prediction, because there are correlations between the features defining the event, and these correlations will deplete some regions of the hypercube and overcrowd others. We are interested in those overcrowded regions, as they might indicate anomalies in the data. For instance, if a new resonance is present in the data, this would create an overdensity in variables connected to its features like the mass, the transverse momentum, and others.
To find overdense boxes, we can apply a normal machine learning minimization tool like gradient descent. Not stochastic gradient descent, as this is a unsupervised task, and it makes no sense to be driven by vagaries in the data: we wall the full information on the gradient, estimated with all the data, at each step. No stupid training vs testing issues: all data are good!
The final result of a scan of overdensities, given an initial box, is a final box which will contain a certain number of events. We can characterize this outcome by a significance measure, like the frequentist probability to observe at least as that number N of events in a box of volume V, and go back to throwing another random set of variables and another random box in that subspace. Of course, the significance has to be "re-calibrated" by accounting for the multiple testing that you are doing by throwing multiple boxes and walking them around in the cube. But that is not hard.
Do the procedure a gazillion times, and you will end up with a box that pretty well represent "THE" most overdense region in the otherwise flattish space.
To test how this procedure works in practice, I produced some mock data (not LHC data yet!). I generated a set of 1000 events in a hyperspace spanning 20 dimensions with a simple recipe: 90% of it are completely flat and featureless - no correlation exists between the 20 features. The other 10% of the data are anomalous, and are overdense in a Gaussian region around the center of 4 of the features, and random on the other 16.
I then generated 20000 random boxes of dimension 6. The minimization finds a very odd box, for a flat distribution: indeed, it recovers the overdense region where the Gaussian is populating the space.
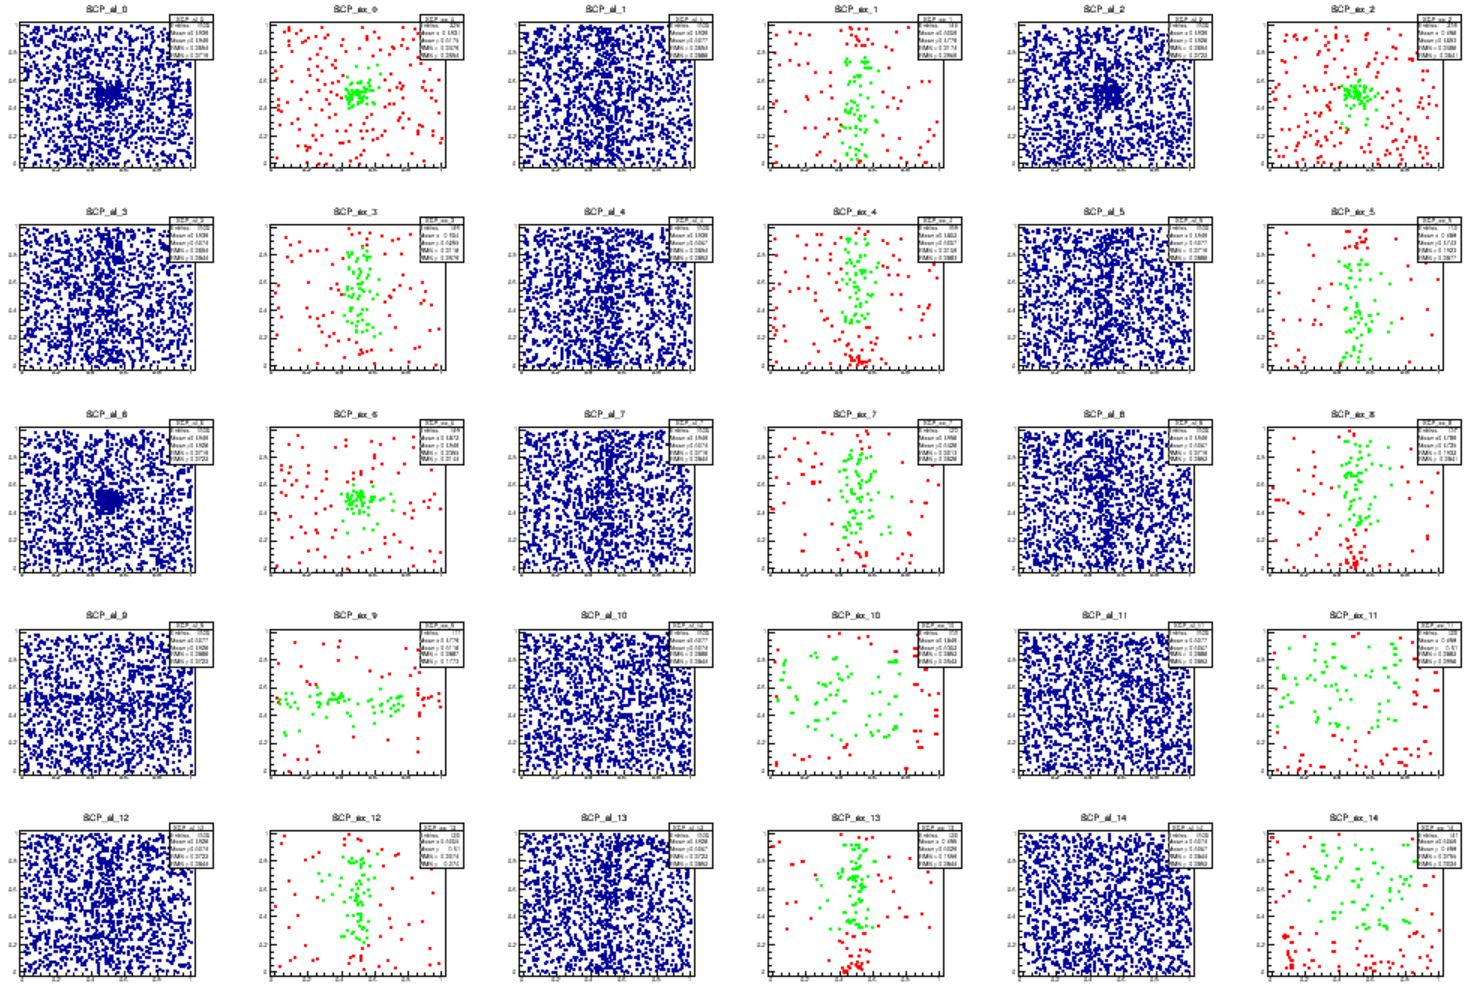
Below, the first graph shows two-dimensional scatterplots of each pair of the six features: 2 vs 1, 3 vs 1, 4 vs 1, 5 vs 1, 6 vs 1, 3 vs 2, 4 vs 2, 5 vs 2, 6 vs 2, 4 vs 3, 5 vs 3, 6 vs 3, 5 vs 4, 6 vs 4, and 6 vs 5. These are shown left to right and top to bottom. There are two plots for each pair of variables: the first, in blue, shows the full dataset; the second shows in green only the data in the selected "overdense" box, and in red the data that pass criteria for being in the overdense box in all the four features not displayed in each of the graphs.
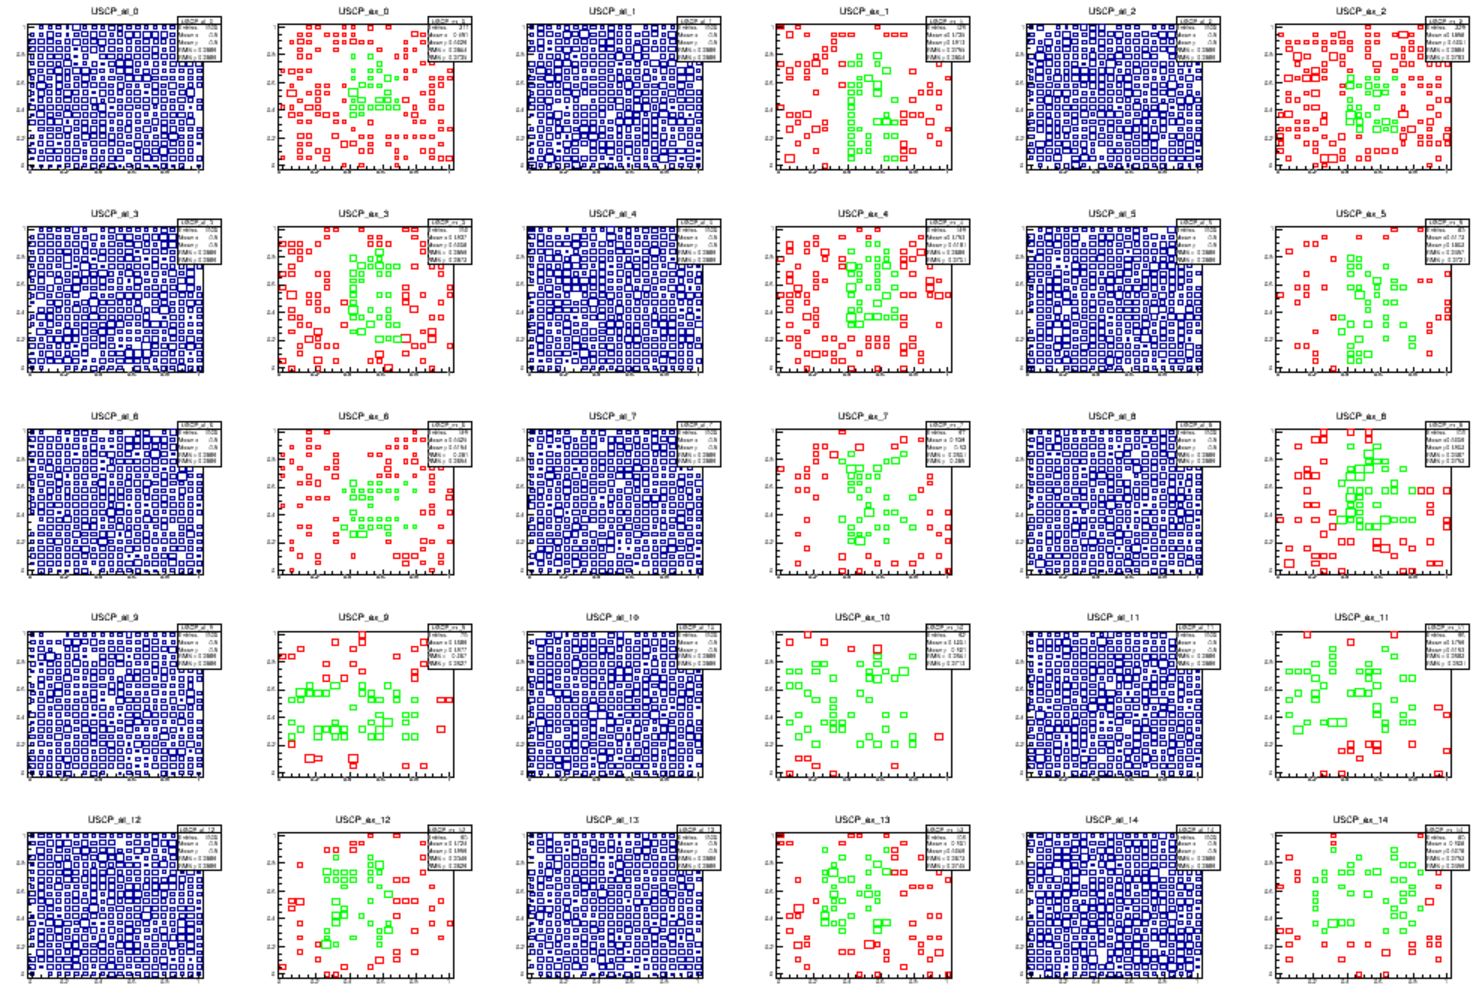
As you can see, the data are indeed quite flattish-looking in the integral-transformed features displayed here. Still, the algorithm has identified a region that contains many more data than would be expected for a flat distribution. Why it has done so? This is clarified by looking at the "untransformed" features, the ones where the Gaussian overdensity was generated. Here you can clearly see the overdensity due to the 10% of Gaussian component in some of the features. And indeed, the green box captures the regions where the overdensity sits. Not all of it, of course, as the box is tasked with finding the "most significant" region.
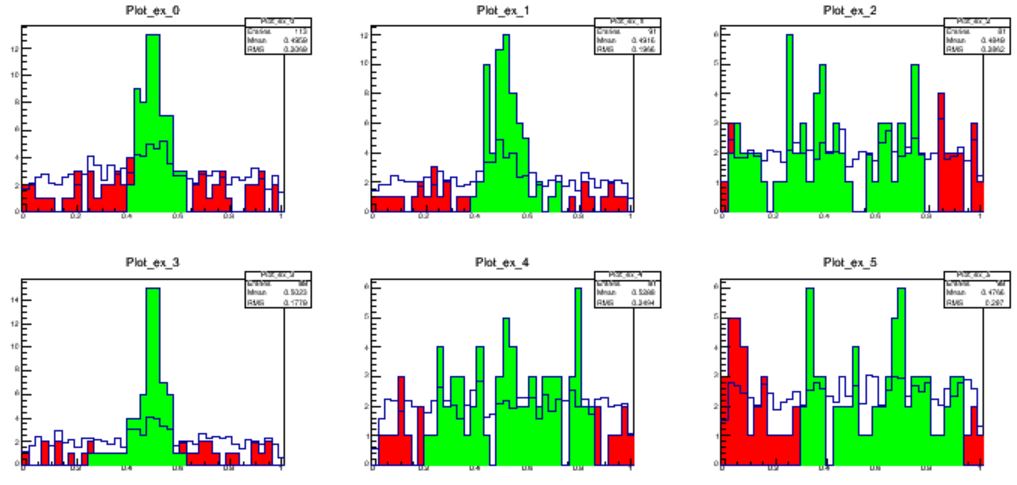
The final graph shows the 1-dimensional features in the untransformed space. here you can see that the RANBOX did identify the overdensity quite well.
All in all, I am satisfied with this primitive, first attempt at putting together some algorithm for LHC anomaly searches. I feel I can move to the next step - participating in the LHC Olympics challenge: finding anomalies in collider data!


Comments