

To be precise, data analysts can be divided further into two classes, as I was once taught by my friend Paolo Giromini (a colleague in the late CDF experiment, about whose chase for new physics I have written in my book "Anomaly!"). These are aptly called "gatherers" and "hunters".
Hunters and Gatherers
The gatherers accumulate understanding and incremental knowledge of the parameters of Nature by measuring things, every time a bit better than the previous experiment or analysis. They climax if they can lower the uncertainty bars on this or that Standard Model parameter by 20%. Which is a huge achievement, mind you: I do not mean to be disrespectful in any way, as I probably belong to that field myself.
Hunters, however, are of an entirely different kind. They go for big game: new particles or phenomena, which the current theory (or sometimes even new physics theories) does not predict. They look at the data for anomalies, and if they see something that smells fishy they can spend a lifetime trying to convince everybody else that they caught something big; for they themselves have already become so convinced about the genuine nature of their find that nothing can convince them of the contrary.
But there's a new kid in town. Machine learning has crept in, and particle physicists are starting to use with confidence many of the tools that computer science has laid on the table. Boosted decision trees are now routinely employed to separate signals from background, and neural networks have started to be used for the same application or for regression tasks.
Unsupervised learning
Those mentioned (classification and regression) are called supervised learning tasks in computer science parlance, as they rely on training an algorithm on data which are "labelled" - here's a signal event, here's a background event: please learn to spot differences in their features. But there are methods that do not need that information: the so-called unsupervised learning algorithms learn structures in data without a need to specify what the data represent.
Unsupervised learning includes the application called clustering, which consists in finding subclasses of some data, each showing more distinct similarities among their elements than the whole data elements do; another task that is unsupervised is the one called density estimation, which is closely connected to many other supervised tasks, like classification.
A class of algorithms that can be considered unsupervised or semi-supervised depending on how they are implemented and used includes what are called anomaly detection ones. Anomaly detection consists in finding something peculiar about subsets of the data. You can help the anomaly finder by specifying how the data should behave if it is all of the same known nature, and let it discover if there is something else (and then this is a semi-supervised task); or you can let the algorithm find out if the data contain local overdensities which might look suspicious; this latter application is unsupervised, and more similar to a related task called density estimation.
A typical particle physics application for an anomaly detection algorithm would consist in taking some data, assumed to all come from known Standard Model processes, and asking the algorithm whether anything is at odds with that hypothesis. Several attempts have been made at producing physics analyses with collider data with that strategy; in general, there is a problem with that, as the Standard Model behaviour requires one to trust the Monte Carlo simulations of the various known physics processes that contribute to the data. And simulation, in my Webster's dictionary, has the meaning of "counterfeit; a sham object".
I think it is much more interesting to let the machine do all the work by itself: here is the data, tell me if there's something odd in it. Of course, a machine learning program with no prior knowledge of what is "odd" and what is commonplace cannot do the job, right?
...Well, not necessarily. For you can take an assumption to start with: the known physics is "smooth". In other words, it populates the phase space of possible event features (think at the various things you can measure when you observe a particle collision: particle energies and directions) in a more or less uniform way.
Of course that is not true in general, and even if you only considered the most commonplace process at the LHC, quantum chromodynamical scattering processes between quarks and gluons it would not be completely true. But we can start with that, and see where we get!
Algorithm proposal
So we have measured, for each collision event, say 30, 40 different, high-level "features" that describe the kinematics of the most energetic (and thus most informative) particles or jets of particles. These 40 observations can be represented by a point in a 40-dimensional parameter space, the feature space the data live in.
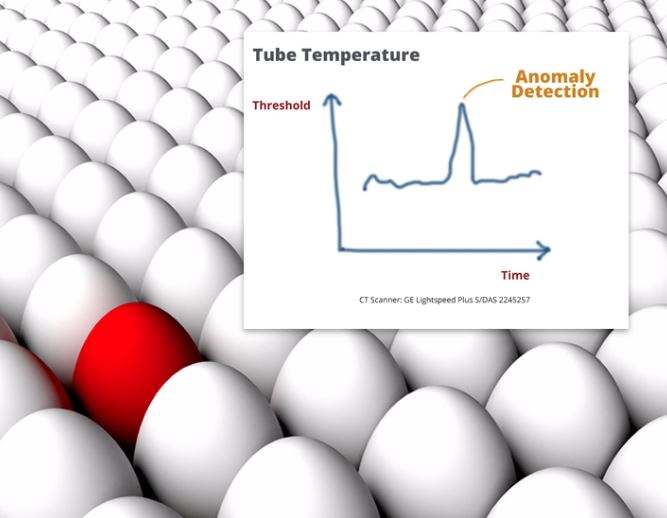
(The graph in the upper right of the above image has little to do with particle physics, but it well illustrate the concept of finding an anomaly in data, as a local overdensity - Image credit: Glassbeam)
Our task is to find "overdensities": anomalous accumulations of events in some region of this 40-dimensional space. They could arise if, e.g., a new heavy resonance were produced and contaminated our experimental data. So out we go scanning the space in search for disuniformities, right? No, because the 40-dimensional space is very, very disuniform even if only known physics populates it! In fact, for every event with two very high-energy jets (say 2 TeV, if you know what I mean) the data contain a billion events with two jets of 100 GeV. In other words, particle physics processes in hadron collisions create events of quite different characteristics at very, very different relative rates. How can anomaly detection be applied to such a situation?
Correlations come to the rescue. A 40-dimensional space is a very, very intricate and complex space. Suppose we look at the projection of the data along each of these 40 "directions": these in statistical parlance are called "marginals". A marginal distribution in the energy of the most energetic jet will show an exponentially falling shape. But what hides in the 39 other dimensions? We can scan each of them individually, but we will never be able to map the intercorrelations they mutually possess.
An overdensity, caused by new physics, would produce an accumulation of data which, for its own nature, would be correlated along several of those 40 directions. Hence one can imagine the following algorithm.
1. Extract from data the marginal distribution of all relevant kinematical variables.
This is easy. You use the data to produce 40 1-dimensional histograms.
2. Construct the comulative distribution of each variable.
Using finely-binned histograms of each variable, you can construct new histograms that describe their "cumulative function": starting from minus infinity (or more practically, from the event with the smallest value of the considered feature), you add 1.0 to the function value every time you find an event. So the cumulative function is monotously growing until you hit the last event, when it will have a value equal to the total number of data events. Divide the cumulative distribution by that number, and you get a monotonous function that grows from 0 to 1 as you go from negative to positive infinity.
3. Transform all event features such that each variable is substituted with the value of the relative cumulative function.
This means that if you have a measured jet energy of 500 GeV for the leading jet, and it so happens that 80% of the data have less than 500 GeV for that observable, you substitute "500" with "0.8".
4. Now that all the data are standardized, they live in a 40-dimensional hypercube with unit side. We have, that is, transformed every point of the original space into a point of a 40-dimensional hypercube, each dimension spanning the [0,1] interval.
At this point, if the features were all independent, we would rightly expect that the data populates the hypercube in a perfectly uniform manner. Of course that won't be the case, but still, the transformation is handy for the treatment of the problem.
5. Now we throw at random four numbers between zero and one, pairwise in ascending order. Further throw two random numbers between 1 and 40. The latter define two of the 40 features; the former two pairs define a lower and upper interval for each of those features. So, e.g. if the numbers are 0.3, 0.8, 0.1, 0.4, 22, 31, then this univocally defines a box in variables 22 and 31, of side [0.3,0.8] x [0.1,0.4].
The box is a bid for a region which could be "anomalous", in the sense that it might contain, due to hidden inter-correlations between any of the other features, more density than naively expected for each feature, in a "naive Bayes" sense. Of course we do expect that correlations between the features of Standard Model data contain more data than what is expected from a purely "phase space volume" consideration. But now we try to quantify this.
6. Throw 10 more random numbers between 1 and 40, excluding the two values already picked (22 and 31 in the above example). Also get 10 corresponding intervals (by randomly picking a lower and upper bound of each feature) for what will be a 12-dimensional hyper-rectangle.
7. Compute the number of events that are found in the hyper-rectangle with the number found in its 10-dimensional sidebands, in the sense described below.
If the two original features are labelled x and y, the "sideband" includes all events that fall in the same x,y interval defined in step 5, but have values of all other 10 variables slightly above or below those defining the hyper-rectangle. This can be arranged by asking that at least one of the 10 conditions (z_min < z < z_max, where z is one of the feature names, and z_min and z_max define the width of the hyper-rectangle in that dimension) is failed by the event, while it fulfils a condition in a slightly broader interval ([z_min-k,z_max+k]). The extension of the broader iterval is governed by a value, k, which is determined by imposing that the volume of the bigger 10-dimensional box is equal to twice the volume of the original box.
8. Now the fun happens: if the data are "smoothly" distributed in the space, the data found in the hyper-rectangle and in the sideband should be compatible. But they won't, and we can compute a p-value of the hypothesis that the two numbers agree (which means that the local data density in the hyper-rectangle we picked is "normal").
Of course, we do not **expect** that the two numbers agree. But the p-value is now a metric to determine how "odd" is the box we picked.
9. Do gradient descent on variables x and y, modifying the upper and lower boundary defining the box in those two variables such that the "most odd" hyper-rectangle is found.
(We cannot do stochastic gradient descent, as this is unsupervised learning and it would make little sense to not use all the data, on which we will later base the inference).
10. The box converges to the region in the above randomly defined 12-dimensional space which is the most anomalous one. Now all the procedure can be repeated by throwing at random more numbers, a gazillion times. This whole process will converge to finding a subspace region which is very much at odds with its surroundings, among all those that include x,y as two of the features. The whole procedure can be repeated for every xy pair (in our 40-D example, this means 1561 times).
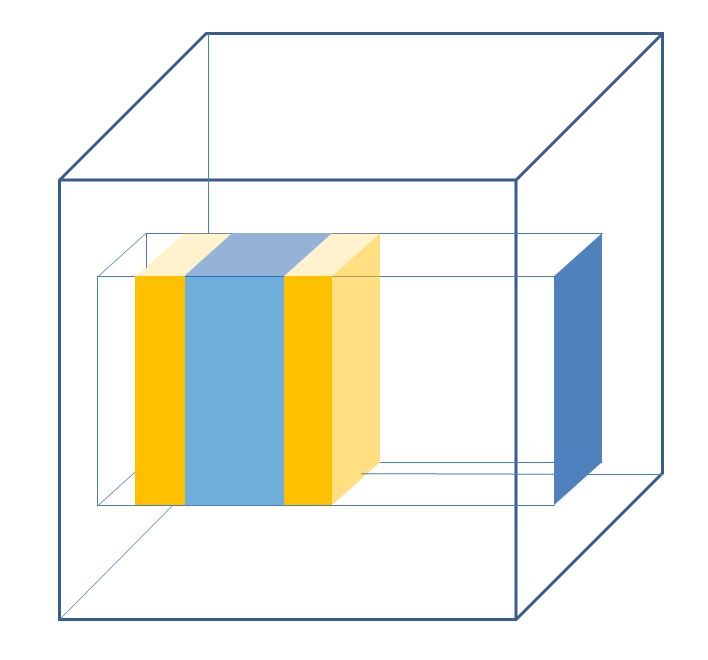
(Above, the xy dimensions define the blue square projected on the right side. This projects in the additional dimensions - here only a third one - where a hyper-rectangle defines a region of interest, shown in lighter blue. The "sidebands" in orange have same volume and for a smoothly varying density distribution should contain approximately the same data as the blue box).
There you have it. The ideas behind the above algorithm are probably not new (I haven't checked the literature yet, as I am on vacation right now), but to me it is - it is entirely of my own cooking.
Will it work?
The question arises: would this work? Would this find new physics in LHC data? Can it be improved?
As for the first question: there might be technical details to straighten out, such e.g. the handling of discrete features, the learning rate of the minimization procedure, the calibration of the calculation of p-values for the anomalies, etcetera. But I do not think it would not "work". Perhaps it is not a very effective way to solve the problem, perhaps it is too CPU intensive...
Also, it might work well on some dataset and much worse on others. A number of parameters are in need of optimization (the number 10 above, the extra dimensions of the multi-D box, is certainly one). But I think that with some work it could indeed be a useful tool.
As for whether it can find new physics in LHC data: my answer is, nobody will, as there is none. But if there were, maybe this algorithm could find it earlier than others, who knows? For now, I am offering it as an Easter gift - maybe one of you wants to try it out!
Finally, of course the idea above can be improved in a number of ways. For instance, the random pick of features defining the subspace to investigate (which is needed because 40 dimensions, which is the common size of a high-level description of a LHC collision event, are too much for distance-based density estimation algorithms) is sub-optimal, and its replacement with some true minimization routine would certainly make things faster and better. I hope you will thus forgive me for the roughness of the above proposal, which was concocted during a night flight from Paris to the Reunion island last Wednesday.
As for me, if I manage to find the time, I will put it together and apply it to an ongoing challenge called The LHC Olympics, which is pretty much about finding anomalies in LHC data. And a second, unrelated task is to find new dark matter signals in LHC data in the context of the DarkMachines "collider searches" working group. If you are interested in working on these tasks, and you are competent as a code writer, send me a line!
---
Tommaso Dorigo is an experimental particle physicist who works for the INFN at the University of Padova, and collaborates with the CMS experiment at the CERN LHC. He coordinates the European network AMVA4NewPhysics as well as research in accelerator-based physics for INFN-Padova, and is an editor of the journal Reviews in Physics. In 2016 Dorigo published the book “Anomaly! Collider physics and the quest for new phenomena at Fermilab”. You can get a copy of the book on Amazon.


Comments