[As a meta-text, this blog column contains a large number of posts written over the years, that describe new results from physics analyses, among other articles commenting on news in science and outside. Such articles have typically aged poorly: while the physics explanations are still valid today, the described news and results are outdated. In this category sit, e.g., posts about the latest limits on the cross section of Higgs bosons in LHC searches, and similar stuff. But then, there are articles on general topics that are not connected with recent events; as such, these articles are "evergreens" that will be useful sources for years to come (or so I hope). This post, which discusses a general feature of hypothesis testing, belongs hopefully to the latter category...]
Is the cat in the room?
An old joke I have seen used in many a presentation at scientific conferences goes more or less like this:
It is difficult to find a black cat...
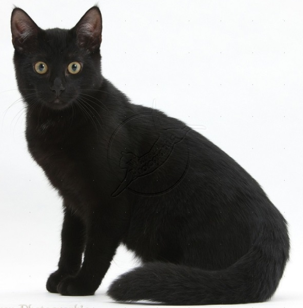
in a dark room...
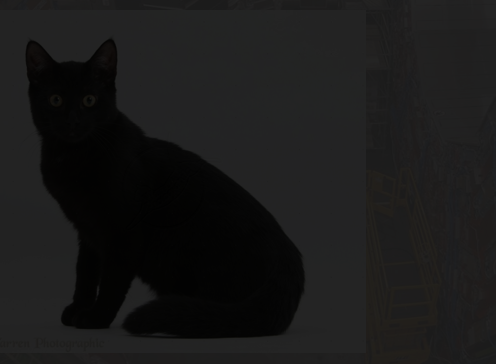
especially if there is no cat!
I used it, too! That was in a presentation about new LHC results I gave about ten years ago at a conference in Valparaiso, when I was discussing searches for Supersymmetric particles. The joke is guaranteed to raise a smile in any audience, and it worked also for me on that occasion.The added value is when you use the construction as an analogy, to project meaning on the intended target, where the contradiction is again meaningful. In that case, the humor also stems from hinting at the disgruntled physicists who aimlessly search for non-existing entities, and they do so in very dark rooms - dark corners of physics phase space. I love well-constructed analogies (and I extensively wrote about their importance in a paper, see here) for their high power in conveying meaning without the overload of detailed explanations of a physical system: you immediately catch the message because you are familiar with the analogy target (the cat and dark rooms), even if you know very little about the source (supersymmetry models and particle kinematics).
Simple-versus-simple Hypothesis Testing
What I think the above joke provides, in addition to the template for searches deemed to failure because of their lack of the sought-for object, is a hint at the underlying framework for statistical inference, where again we can draw a lesson or two. The framework in question is hypothesis testing, and let me specify that here I will discuss "simple-versus-simple" hypothesis testing (SvSHT), as this contains the essential ingredients and it is stripped of complications arising from nuisance parameters existing only in one of the alternative hypotheses (bear with me for the jargon here).
In SvSHT, one has to decide whether some data support one of two competing, and disjunct, hypotheses. Either there is a cat in the room, or there isn't one - tertium non datur. So let's jolly well forget about particularly small or odd cats, cats in-bred with other animals, rooms with not well defined boundaries, or other perversions of the original stipulation.
Note that it is important to specify that we want a dychotomic system in SvSHT, and this is crucial if we are doing experimental physics, because this is always an idealized scenario - a model of the physical world that simplifies all the unnecessary complexities. As was once famously said, all models are wrong, but some are useful. In LHC searches for Supersymmetry, you would have to spend at least half a page to explain what it is a model of the world that has supersymmetry in it versus one that hasn't, as the latter might include some alternative theory that has some features in similarity with Supersymmetry, e.g.; or the Susy model hypothesis might include versions that make no supersymmetric particle visible to available detection methods. But no, SvSHT will not deal with strange cats and weird rooms. It's simple: either one or the other hypothesis is correct, not both, not neither.
Ok, let's move past that. So, a SvSHT setup is one where you have some data, and you use the data to construct a sensitive test statistic T that can distinguish the two scenarios. T will do the trick because if you sample data from the universe where the first of the two hypotheses is true - let us call this default hypothesis the "null", and label it as H0 - T will distribute along a real axis with some functional density form (a probability distribution) H0(T), with a median value we may call T0; while if you sample data from the universe where the other "alternative" hypothesis is true - call it H1 - T will distribute with a different probability distirbution function H1(T), of median value T1 which without loss of generality we here assume to be higher than T0.
I did not say how T was computed from the original data, but this is inessential here as it is not part of the statistical construction. You compute T for your experiment with some predefined recipe (that is supposed to extract from your data as much information as possible about which of the two hypothesis is likely) and obtain a value T*, which you immediately get to compare in value to the two expected distributions.
The alert reader will now jump ahead and state that T* can immediately say which hypothesis is more likely - just look at the value of the two distribution functions H0(T) and H1(T), and pick the one with the highest value at the measured T=T*. Correct! But this is not hypothesis testing. What we want to do, instead of talking in probabilistic terms about the probability of the hypotheses given the observed data (which a Frequentist statistician will dread doing, while a Bayesian will be keen on doing, but let us leave that aside), is to define a prescription for being able to exclude the null hypothesis in favor of the alternative.
In cat terms, this equates to being able to say conclusively "there indeed is a cat in this dark room!", given the available information and, crucially, given a prescription for the fraction of times that we allow ourselves to make a false claim. This is usually a small number, e.g. say, 5%, or an even smaller one if you want your test to be stricter - more severe, in statistical terms. The way this works is by taking the integral of the H0(T) distribution from T* to infinity, summing the probability distribution in the critical region T>T*. That integral amounts to a number between 0 and 1, because probability density functions are normalized to have an all-support-integral equal to 1. If the integral is very large (say, >50%) that means that we should actually expect T* to have come out larger than what we actually measured, given H0. Hence we certainly cannot exclude H0! If instead it is smaller than the defined threshold, we can proceed and exclude the null hypothesis (and accept the alternative, which has a larger integral from T* to infinity because its probability density takes on higher T values).
Note: SvSHT only works if you declared your "Type-I error rate", A.K.A. alpha, before you have collected your data and computed T*. For this reason, alpha is a predefined quantity that typically is driven by consensus and common practice, and only varies across disciplines. For drug testing, physicians will use 5% to determine whether there is a correlation between a drug consumption and an effect. For particle physics discoveries, alpha is as small as 0.3 millionths! That is the 5-sigma criterion I have discussed many times in this column (the integral from five sigma to infinity of a Gaussian distribution is indeed 0.3 millionths).
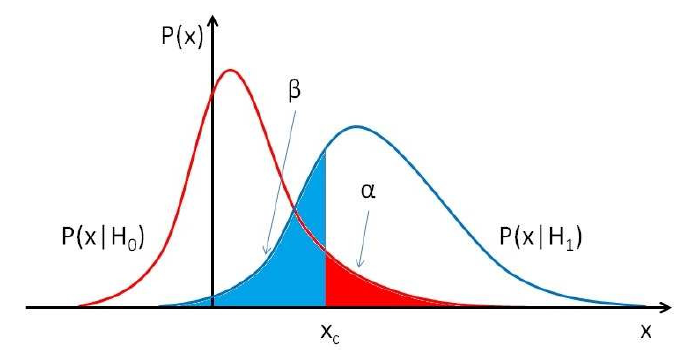
[In the figure above, the test statistic is labeled X instead of T, and H0(T), H1(T) distributions are indicated as P(X|H0), P(X|H1). The "critical region" in red is the one where the integral of the red distribution from Xc to infinity is equal to alpha, the prescribed type-1 error rate. Beta is conversely the type-2 error rate, which indicates how often we will on average fail to accept the alternative hypothesis H1 as true, when H1 is indeed true. A stricter choice of alpha (so a smaller probability of claiming H1 is true when it is not) produces a larger value of beta (a higher probability to fail to claim that H1 is true when it is).]
When you cannot possibly say whether the cat is there or not
The interesting observation I would like to end this post with concerns the not-so-rare case in which the two hypotheses cannot be distinguished by the collected data: the data are insufficiently precise, or not informative of the hypotheses at hand. When something like that happens, you know it because once you determine the density functions H0(T) and H1(T), these lay on top of one another, or are anyway very similar. Under such circumstances, a high measured value T* that corresponds to a small integral of H0(T) - e.g. one that is below the alpha level - will also correspond to a small integral of H1(T). Are we going to conclude from such data that both H0 and H1 are false? No! For remember, we are doing SvSHT and the world is either described by H0 or by H1: the cat is either in the room or not. So what can we say then? We have better not collect any data under such circumstances!
A situation in which we can't say whether the cat is in the room or isn't is more common than one would imagine. For many new particle searches at the LHC and in other particle physics experiments, we simply have no sensitivity to those particles if their mass is very high (because our collisions may have failed to produce enough of them to make a difference in the data). So it is important to know where to draw the line between searches we can legitimately perform and ones we should not! A good mnemonic rule springs to mind after reading this post: "If it is too dark, avoid claiming you know whether there is a cat in the room!"