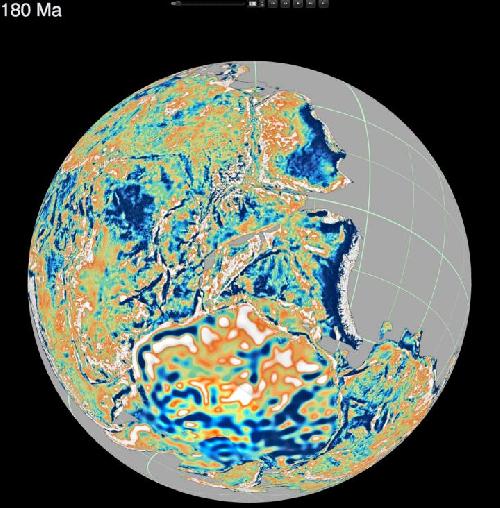
How did Madagascar once slot next to India? Where was Australia a billion years ago?
Cloud-based virtual globes developed by a team led by University of Sydney geologists mean anyone with a smartphone, laptop or computer can now visualise, with unprecedented speed and ease of use, how the Earth evolved geologically.
Reported today in PLOS ONE, the globes have been gradually made available since September 2014. Some show Earth as it is today while others allow reconstructions through 'geological time', harking back to the planet's origins.

Uniquely, the portal allows an interactive exploration of supercontinents. It shows the breakup and dispersal of Pangea over the last 200 million years. It also offers a visualisation of the supercontinent Rodinia, which existed 1.1 billion years ago. Rodinia gradually fragmented, with some continents colliding again more than 500 million years later to form Gondwanaland.
"Concepts like continental drift, first hypothesised by Alfred Wegener more than a century ago, are now easily accessible to students and researchers around the world," said University of Sydney Professor of Geophysics Dietmar Müller.
"The portal is being used in high schools to visualise features of the Earth and explain how it has evolved through time."
The virtual globes includes visual depictions of a high-resolution global digital elevation model, the global gravity and magnetic field as well as seabed geology, making the amazing tapestry of deep ocean basins readily accessible.
The portal also portrays the dynamic nature of Earth's surface topography through time. It visualises the effect of surface tectonic plates acting like giant wobble boards as they interact with slow convection processes in the hot, toffee-like mantle beneath Earth's crust.
"When continents move over hot, buoyant swells of the mantle they bob up occasionally causing mountains," said Professor Müller. "Conversely the Earth's surface gets drawn down when approaching sinking huge masses of old, cold tectonic slabs sinking in the mantle, creating lowlands and depressions in the earth's crust."
Since its inception the portal has been visited more than 300,000 times from more than 200 countries and territories. Individual globes have featured in numerous media articles around the world. The seafloor geology globe is the most popular, viewed on average 500 times per day. The globe allows the viewer to explore how different types of deep-sea sediments vary between ocean basins, and at different latitudes and depths.
"These cloud-based globes offer many future opportunities for providing on-the-fly big data analytics, transforming the way big data can be visualised and analysed by end users," said Professor Müller.
The interactive globes can be viewed on any browser at: portal.gplates.org


Comments