Electric cars are currently limited in utility, which means continued government subsidies and high cost, because battery technology has not changed in the last 35 years. When everything else in a technology cycle is funded by tax capture, there is no incentive to improve, which is why both charging technology and battery packs are stuck in the phone equivalent of 1G analog.
A recent analysis sought to examine why EV batteries perform and degrade so inconsistently under real operating conditions - supernatural claims from China aside - and found that they really are a chain crippled by the weakest link; the fastest aging cells.
A home-use AA or AAA alkaline or lithium-ion battery is a single cell. Electric car batteries are just the simplest solution to more voltage, throwing a lot more cells into a casing. In the real-world, users have expressed frustration in the decline of battery performance, even if they are not in areas where it gets cold. Batteries can be inconsistent even if the manufacturing is identical. There was a popular videos of someone blowing up their electric car because a replacement battery pack cost more than a car was worth. Software and technology are 2026 but batteries are still stuck in 1992.
The reason is that the worst cell will hit the upper voltage level and the entire thing will stop charging for safety reasons. The new analysis bypassed the laboratory measurements no one believes anyway and compiled mass data for system-level performance.
Data included popular nickel-manganese-cobalt batteries and more budget-friendly lithium-iron-phosphate in cars and buses, operating across years and over 100,000 miles. They fed the data into a neural network (the popular LLM "AI" technologies like ChatGPT are one type of neural network, not all neural networks are LLMs) and then compared individual cells over time to reference conditions. That gave them six metric to use for their quantification: cell state of health; energy-resource utilization; lifetime utilization; pack health; power capability utilization; and state-of-charge utilization.
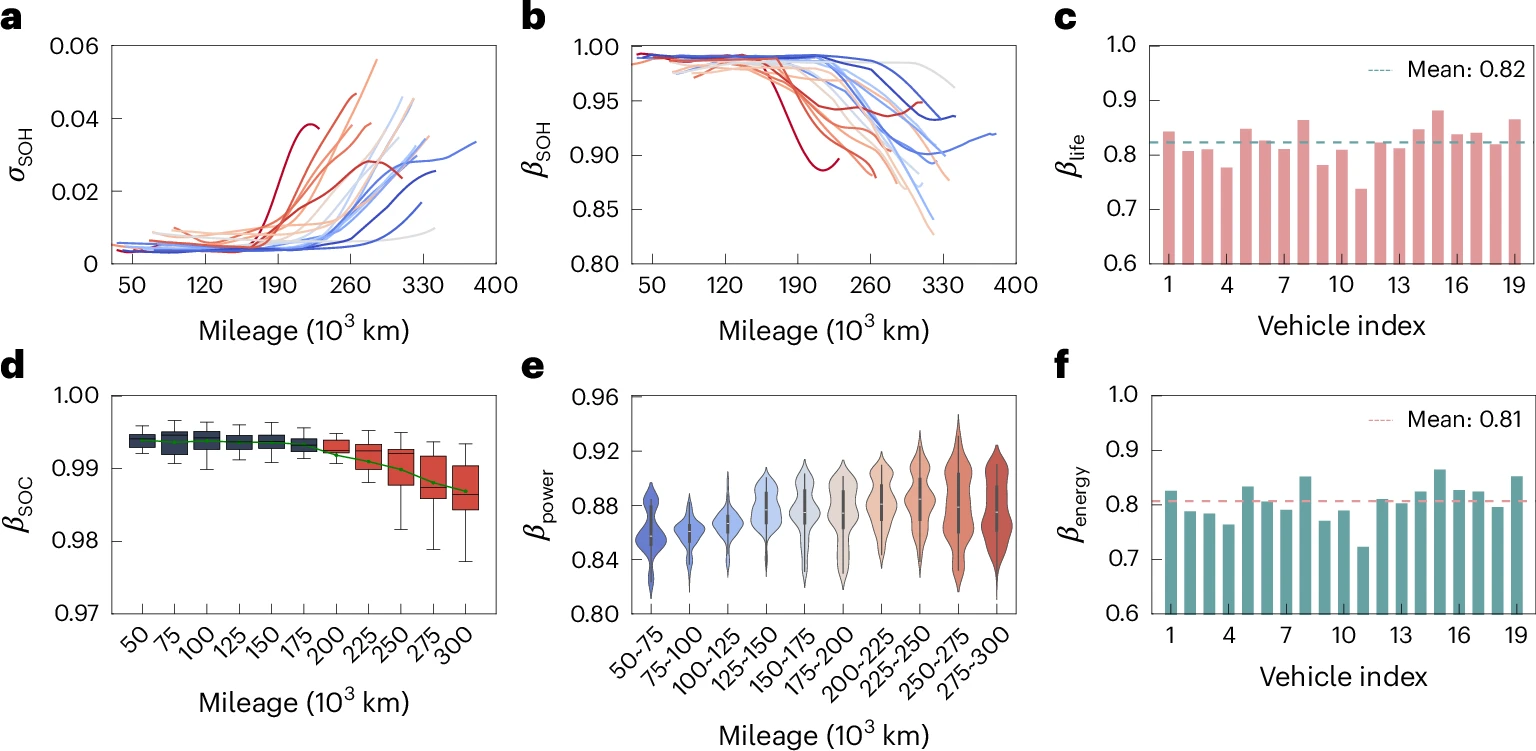
a, Standard deviation of cell SOH values within each pack (σSOH) as a function of accumulated mileage for 19 electric cars; each curve represents one car. b, SOH utilization rate in each vehicle (βSOH), constrained by the most aged cell. Averaging βSOH at each car’s end of life yields 0.938, corresponding to a 6.2% reduction in pack health attributable to cell imbalance. c, Utilization rate of battery lifetime (βlife), showing the extent of lifetime reduction due to early retirement of the most aged cell. The fleet average is 0.823, indicating a 17.7% shortening of pack lifetime. d, Utilization rate of battery SOC (βSOC), which quantifies the impact of cell inconsistency on the pack’s actual charged capacity. Red boxplots mark stages of pronounced decline. βSOC generally remains above 0.98 overall, indicating a reduction generally below 2%. e, Utilization rate of battery power capability (βpower), limited by cell resistance inconsistencies. The fleet average is 0.871, corresponding to a 12.9% power loss. f, Utilization rate of battery energy resources (βenergy), determined by βSOC and βlife. The fleet average is 0.807, meaning that 80.7% of the available energy resources are utilized over the operational lifetime of these EVs. For the boxplots in d, the centre line indicates the median, box bounds indicate the 25th and 75th percentiles, and whiskers extend to the most extreme non-outlier values within 1.5 times the interquartile range; outliers are not shown. For the violin plots in e, the width represents the distribution density of values within each mileage bin.
Electric cars did reasonably well until they hit about 75,000 miles and then individual cells differed dramatically, and took battery utility with them. Charge life dropped over 17 percent for cars and nearly 23 percent for buses. This would be okay if the cost premium for purchase and ancillary expenses was not so high. The authors conclude that lifetime energy-resource utilization of cars was only 80.7% and buses were only 72.9% - big drops in potential usability.
The average cell age matters less than the weakest cell
What to do? Software is far ahead of battery technology so the only solution may be even better thermal management and balancing control. Whatever it takes to prevent cell-to-cell inconsistency that drags down the whole process.
Citation: Zhou, L., Bian, X., Zhang, Y. et al. Quantifying the impact of cell-to-cell inconsistency on electric vehicle battery degradation and utilization. Nat Energy (2026). DOI: 10.1038/s41560-026-02131-5