A few days ago I put my hands on a RadiaCode 103, a pocket radiation counter, dosimeter, and spectrometer that has recently appeared on the market. The company that produces it, RadiaCode, is located in Cyprus (see https://radiacode.com). The instrument is a portable device that pairs up with a smartphone or a PC for maximum functionality, but can well operate as a standalone unit to provide quite a bit more functionality than the standard monitoring and dosimeter capabilities of other instruments.
Here is the unit as it comes, packaged in a style similar to that of smartphones. The package contains the unit and a USB-C cable, plus a card with a QR-code link to the manuals and software.
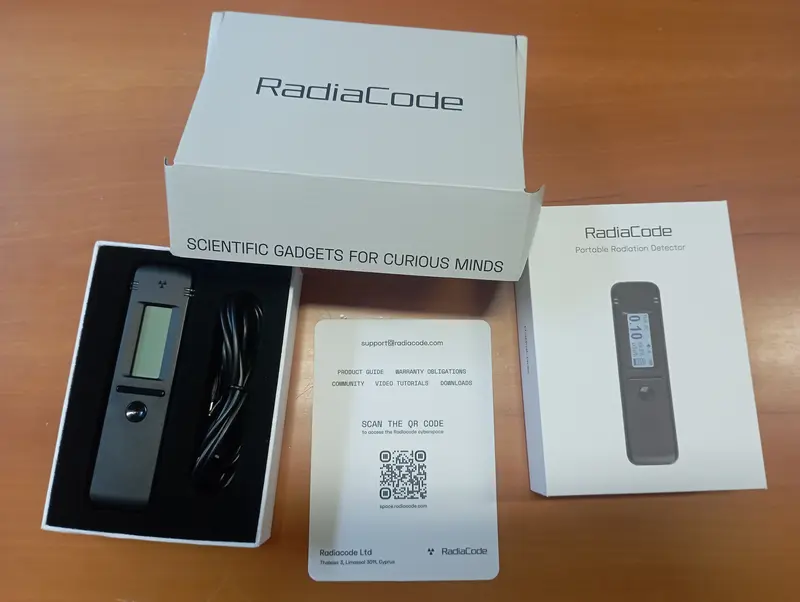
Above: the RadiaCode 103 and its packaging set
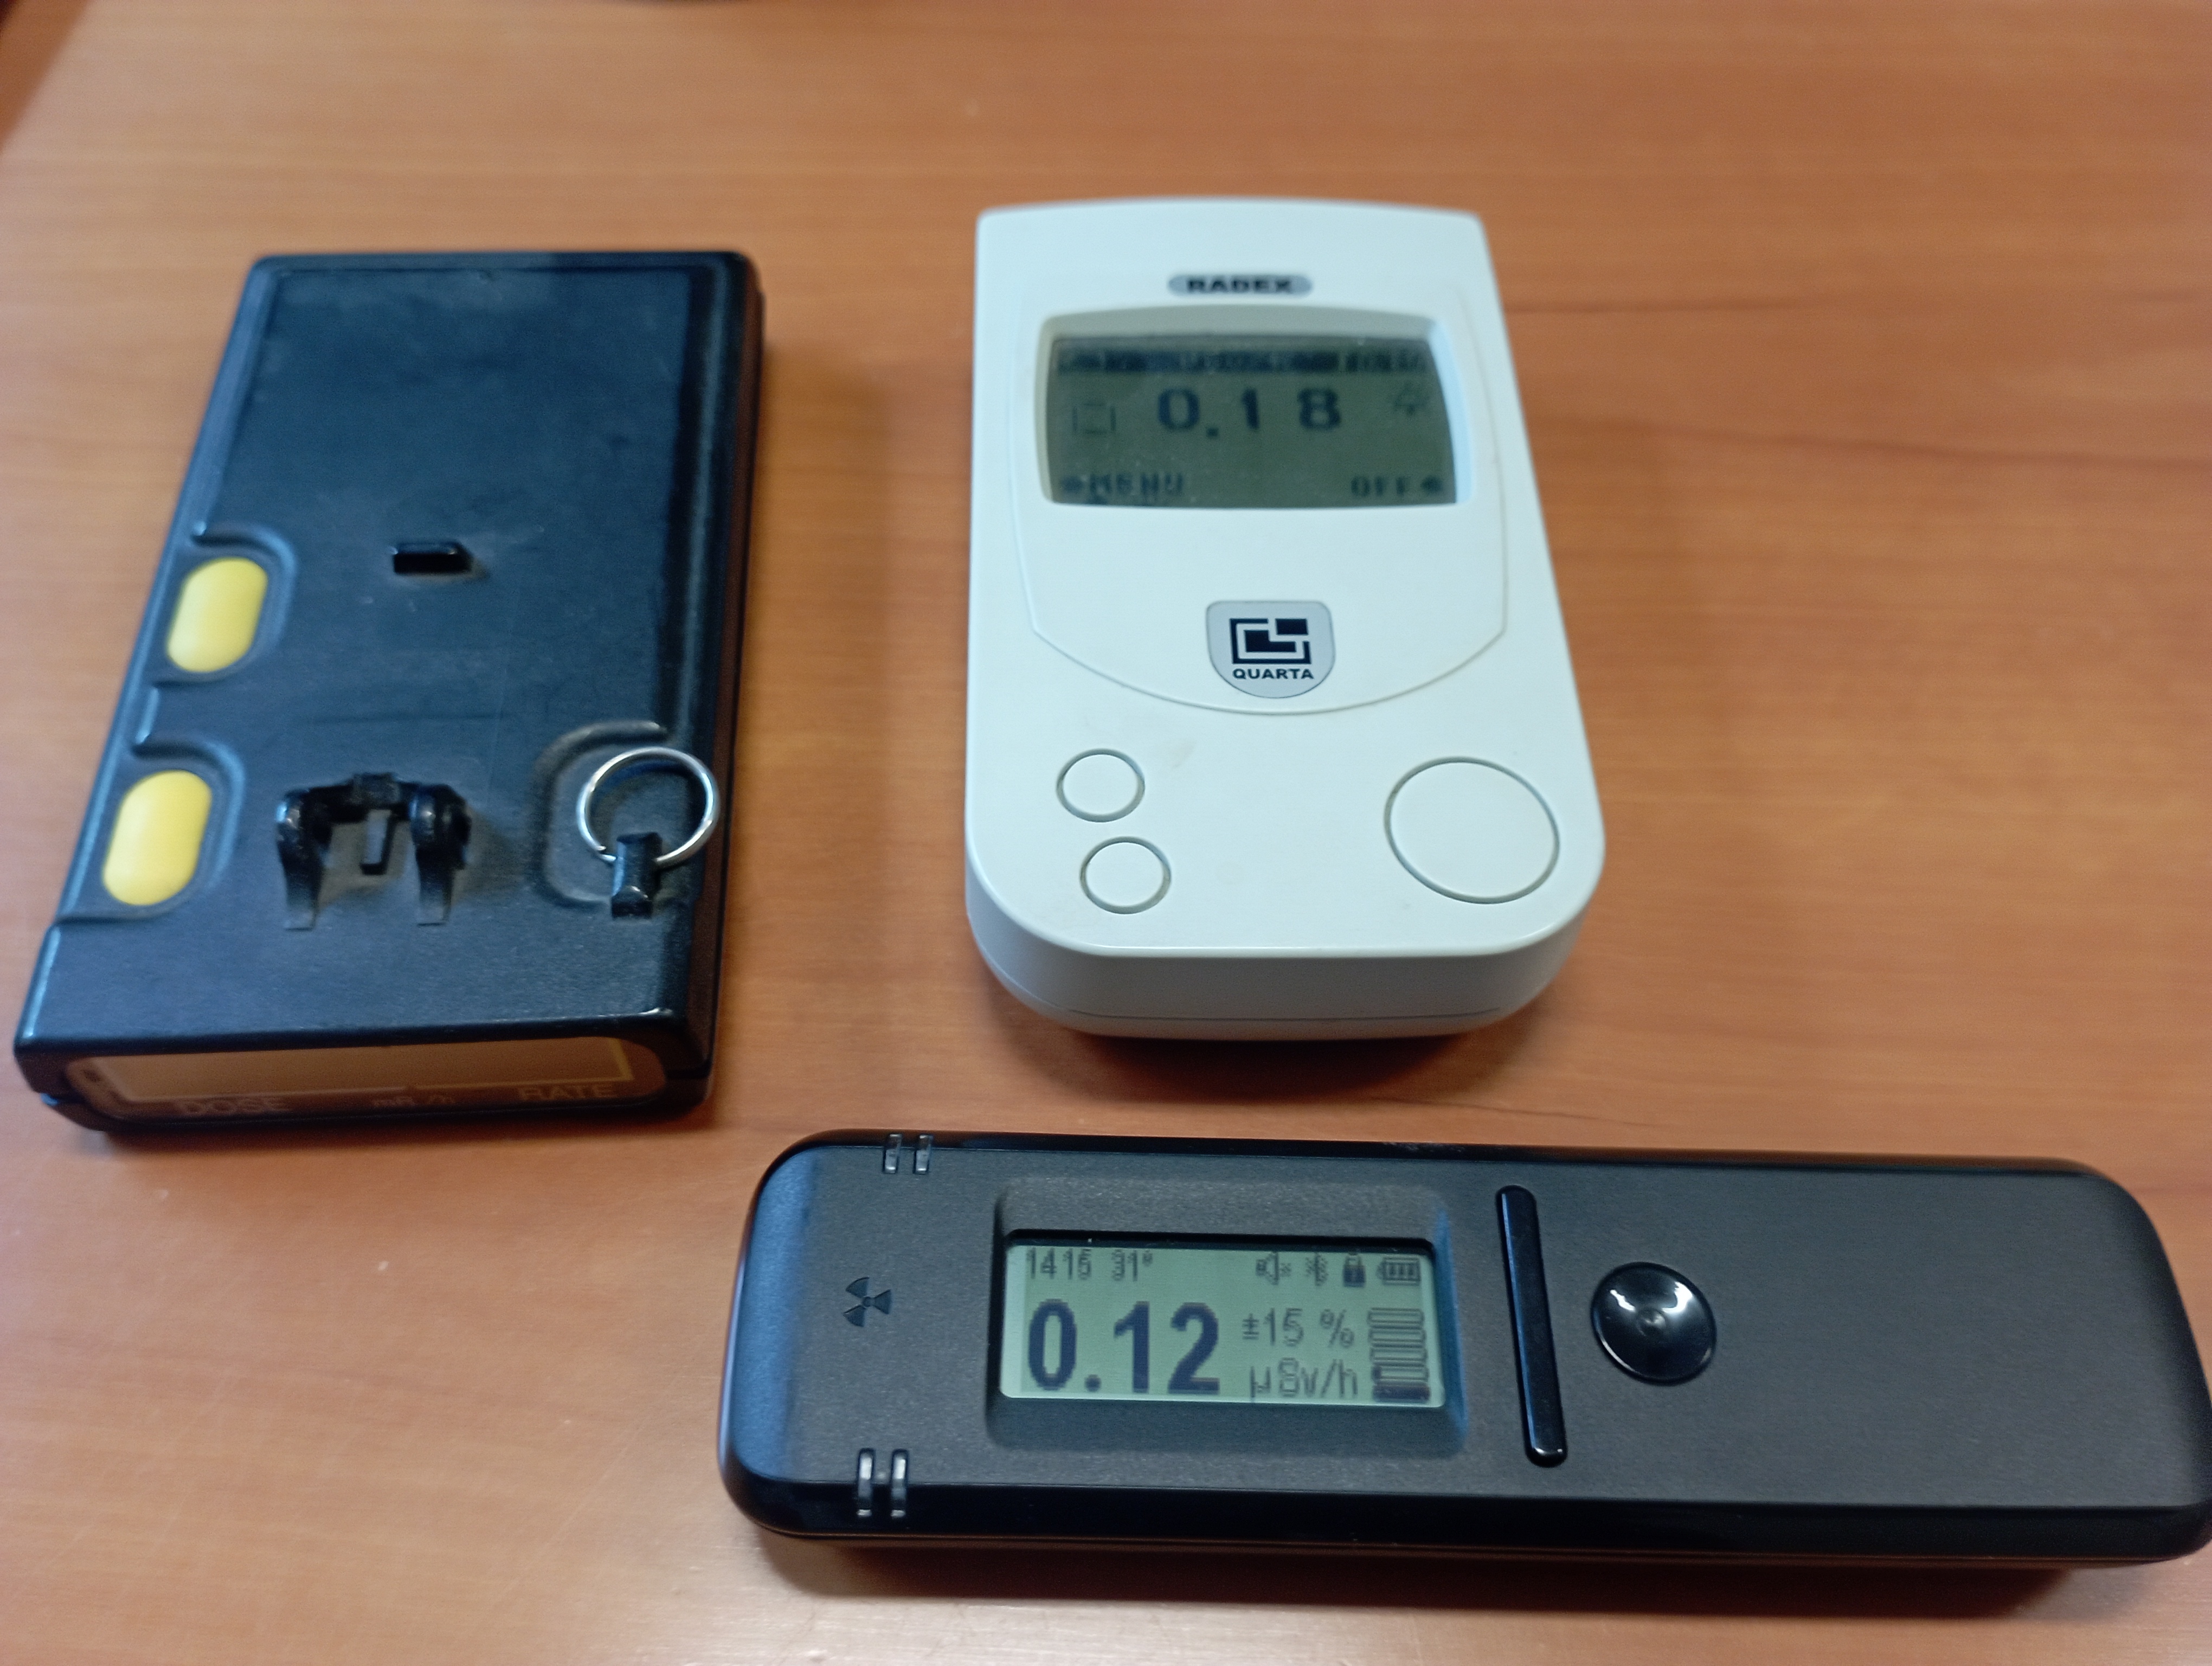
Above: my collection of dosimeters and counters is growing...
At a weight of barely 67 grams (2.4 ounces), the RadiaCode fits comfortably in your shirt pocket, or gets to bounce around in the pocket of your pants (the company sells separately a nice folder that you can attach to your belt - I think I am going to get one). Also, its capient battery and very limited power consumption guarantee hundred of hours of continuous operation, so you may indeed forget you are wearing it - save for the occasional alarm that may be triggered by walking past a source of gamma radiation. In this post, which is only the first of a series I intend to write to characterize the spectrometer and to report on its possible uses, I will jump at random to a few observations on the performance it shows. So why not starting with precisely that feature: sensitivity to transient sources.
In their advertisements, RadiaCode claim that the high sensitivity of the device allows you to really become sensitive to localized sources of radiation without the need of spending time scanning the area as you would with a metal detector: just walking by a source at 3 miles per hour is enough for the instrument to pick up the signal from even relatively weak sources. When I read this, I was immediately triggered to know more and to verify the claim, as my past experience with similar instruments was quite different.
Radiactivity is a universal phenomenon and we are constantly immersed in it - radionuclides in the ground, in rock, and cosmic rays bombard us daily with ionizing radiation. Fortunately, most of these sources are extremely weak, and they cause no harm. This also means that testing a radiation counter may not be immediate - you either have a source of radiation handy, or must wait until your next flight, when you can pass the counter inside an x-ray machine or keep it on while the airplane flies to high altitude (thereby exposing the instrument to cosmic ray rates of 10-20 times the normal background on the ground). With the RadiaCode, however, the high sensitivity of the detector (a cubic centimeter of sodium iodide scintillator) allows for a more casual use: the instrument will be able to map the radiation level wherever you go, creating nice maps overlaid to google earth ones:
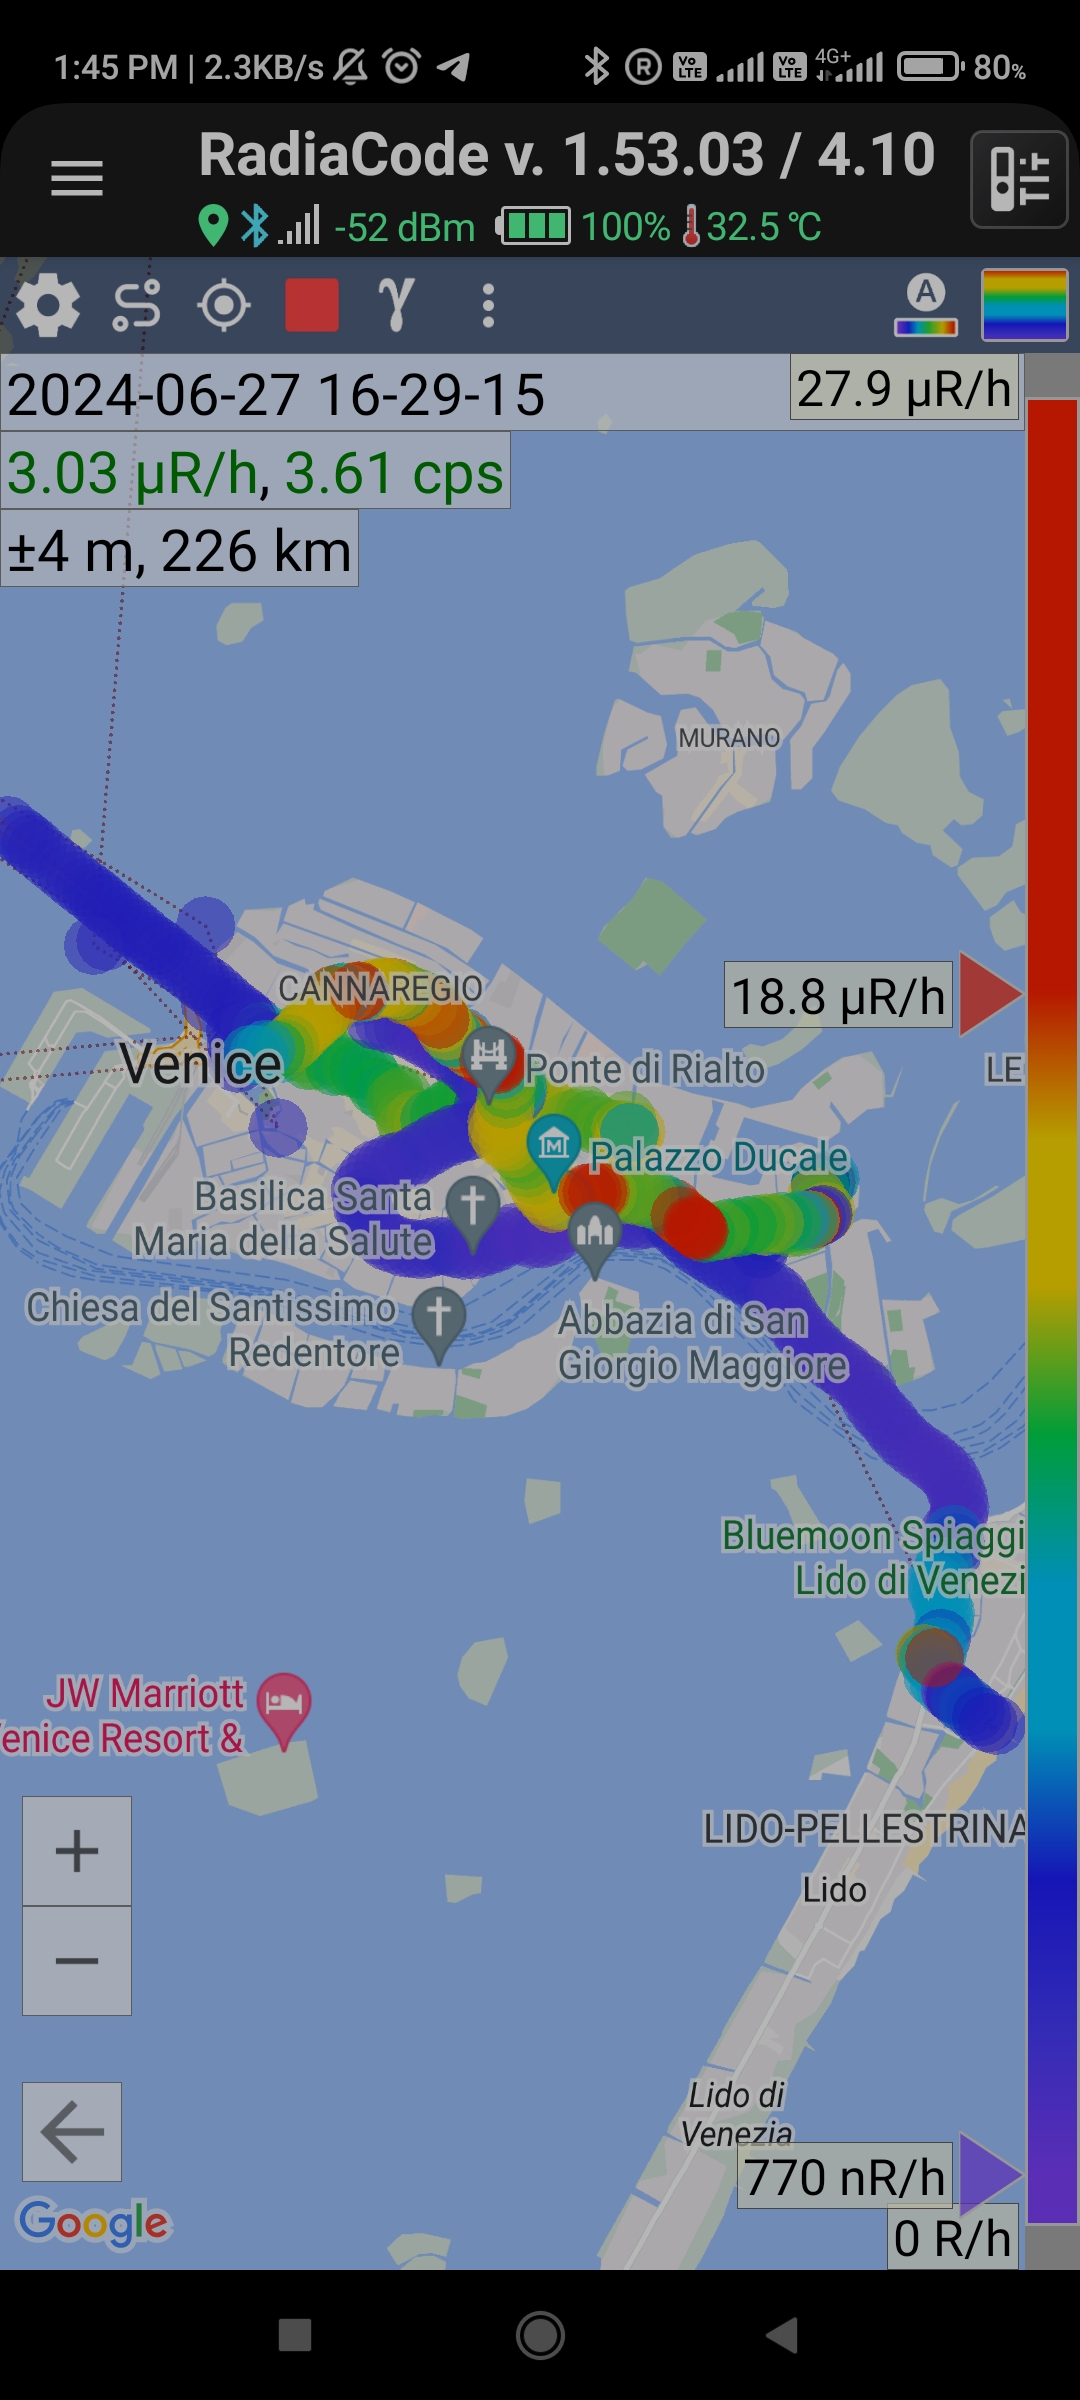
Above: radiation map of some parts of the city of Venice. The bluish (low-radiation) readings follow the path of the train and boat I took on my way to Lido - readings in public means of transportation are typically low because they are far from rocks and there is good ventilation.
And then, if you walk past a person that has been injected some radionuclides for diagnostic purposes, or by the occasional dirty nuke bomb that a terrorist is carrying to destination, you will get a visual and auditory alarm. That is exactly what happened to me the other day, and when it did I was very surprised to see how sharply the instrument was able to catch the signal. In the matter of two seconds it produced two independent rate alarms, and a graph of the radiation estimate showed a clear peak:
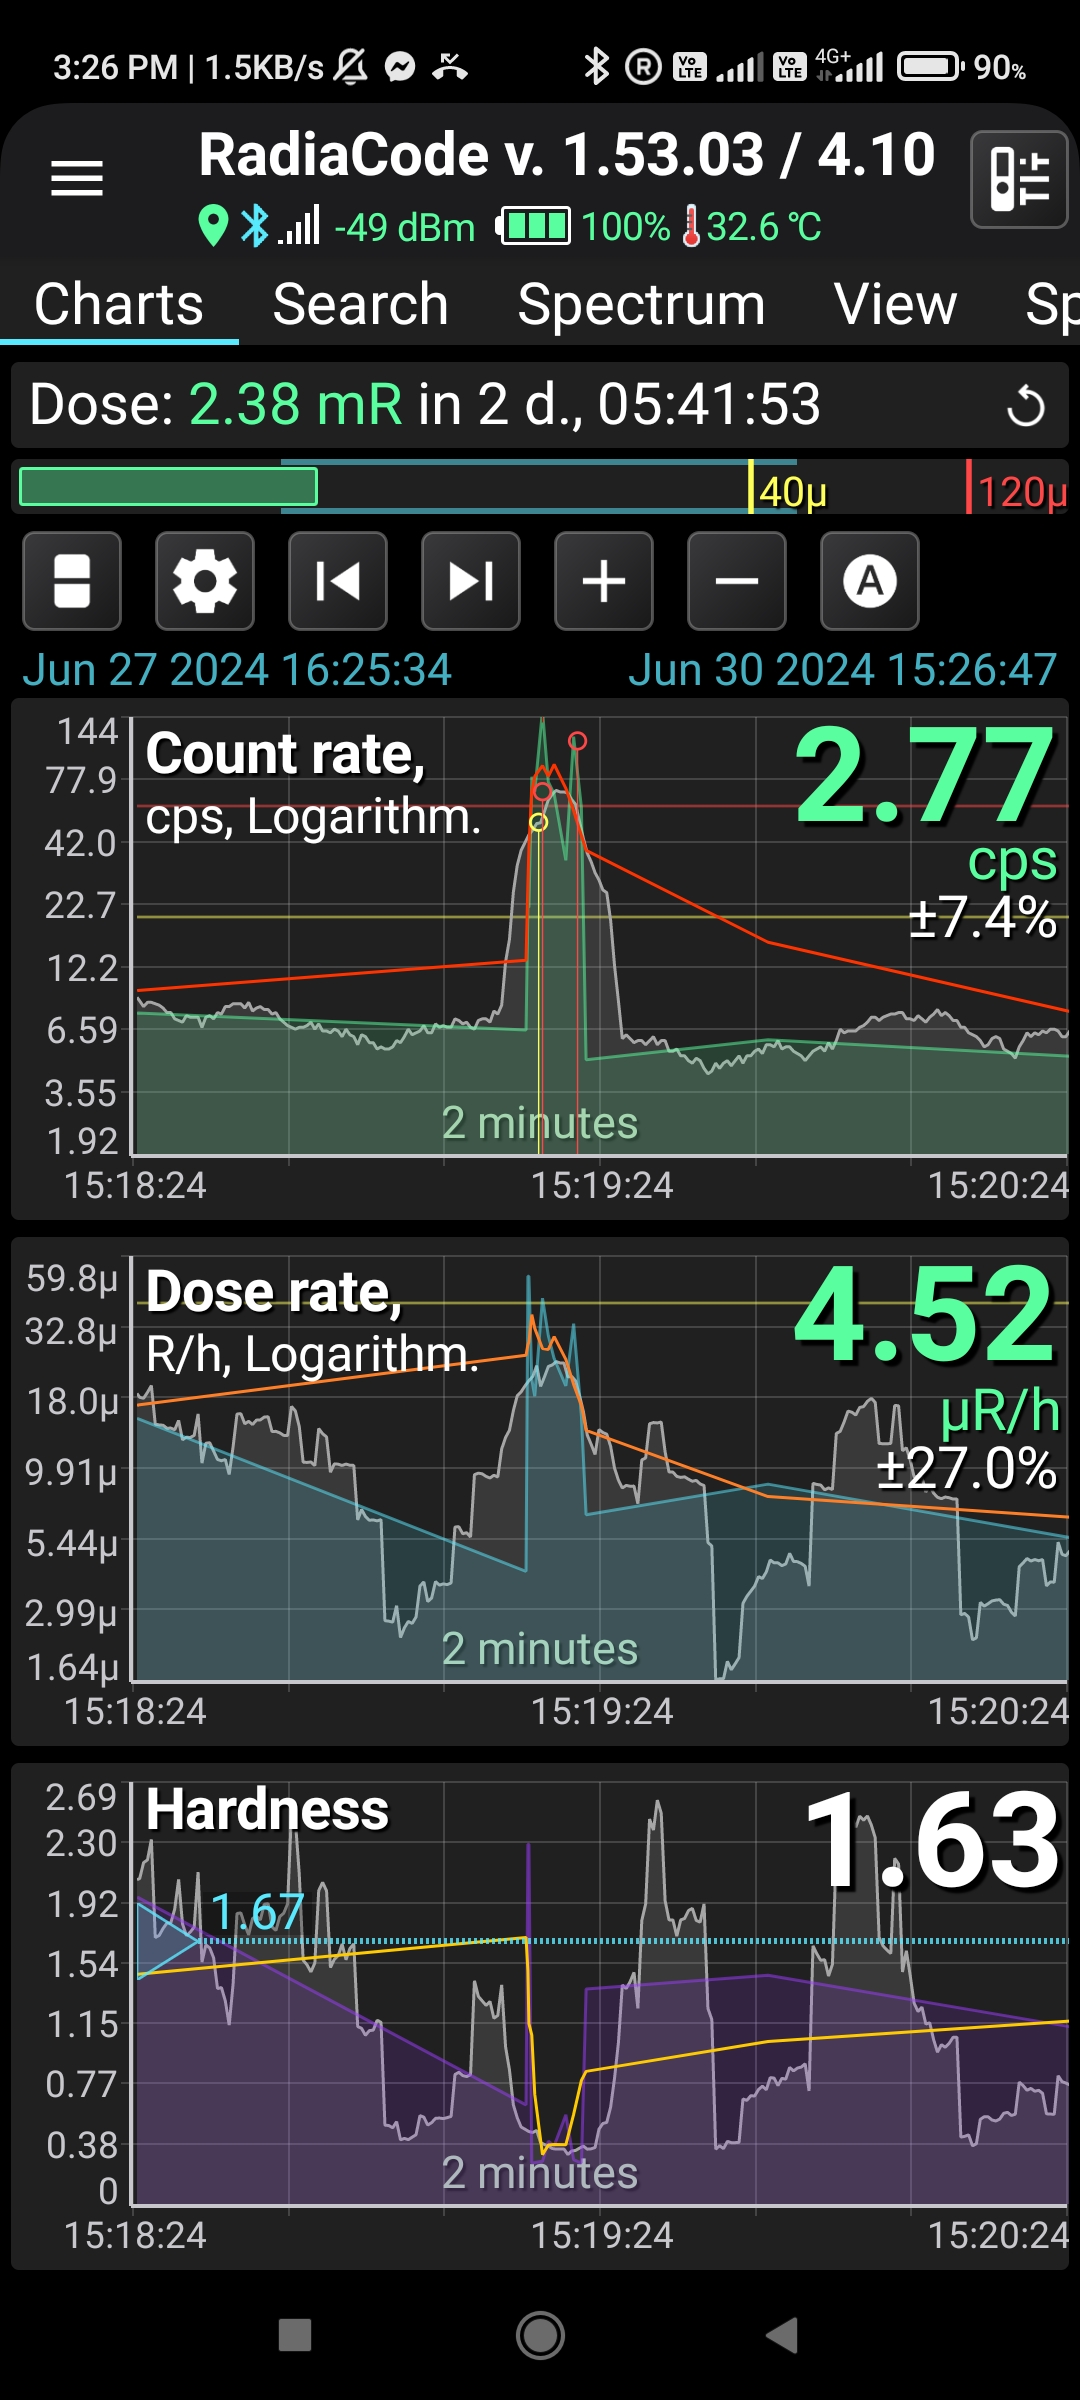
Above: The monitoring view of the smartphone app shows the alarm event both as a spike in the count rate, and in terms of dose rate (center); an instantaneous reading of the hardness of the spectrum (bottom; see below) in this case indicates that the involved isotope was probably an Americium source.
As you can see, the count and dose rate graphs both peak within a time window of less than 5 seconds (graphs are in logarithmic scale, so the shown features are quite significant). The log also provides useful data - 41.8 microRems per hour, and a counting rate of 114/s were recorded. This high speed - basically an instant response - really allows you to move around fast while still being sensitive to what is going on around you.
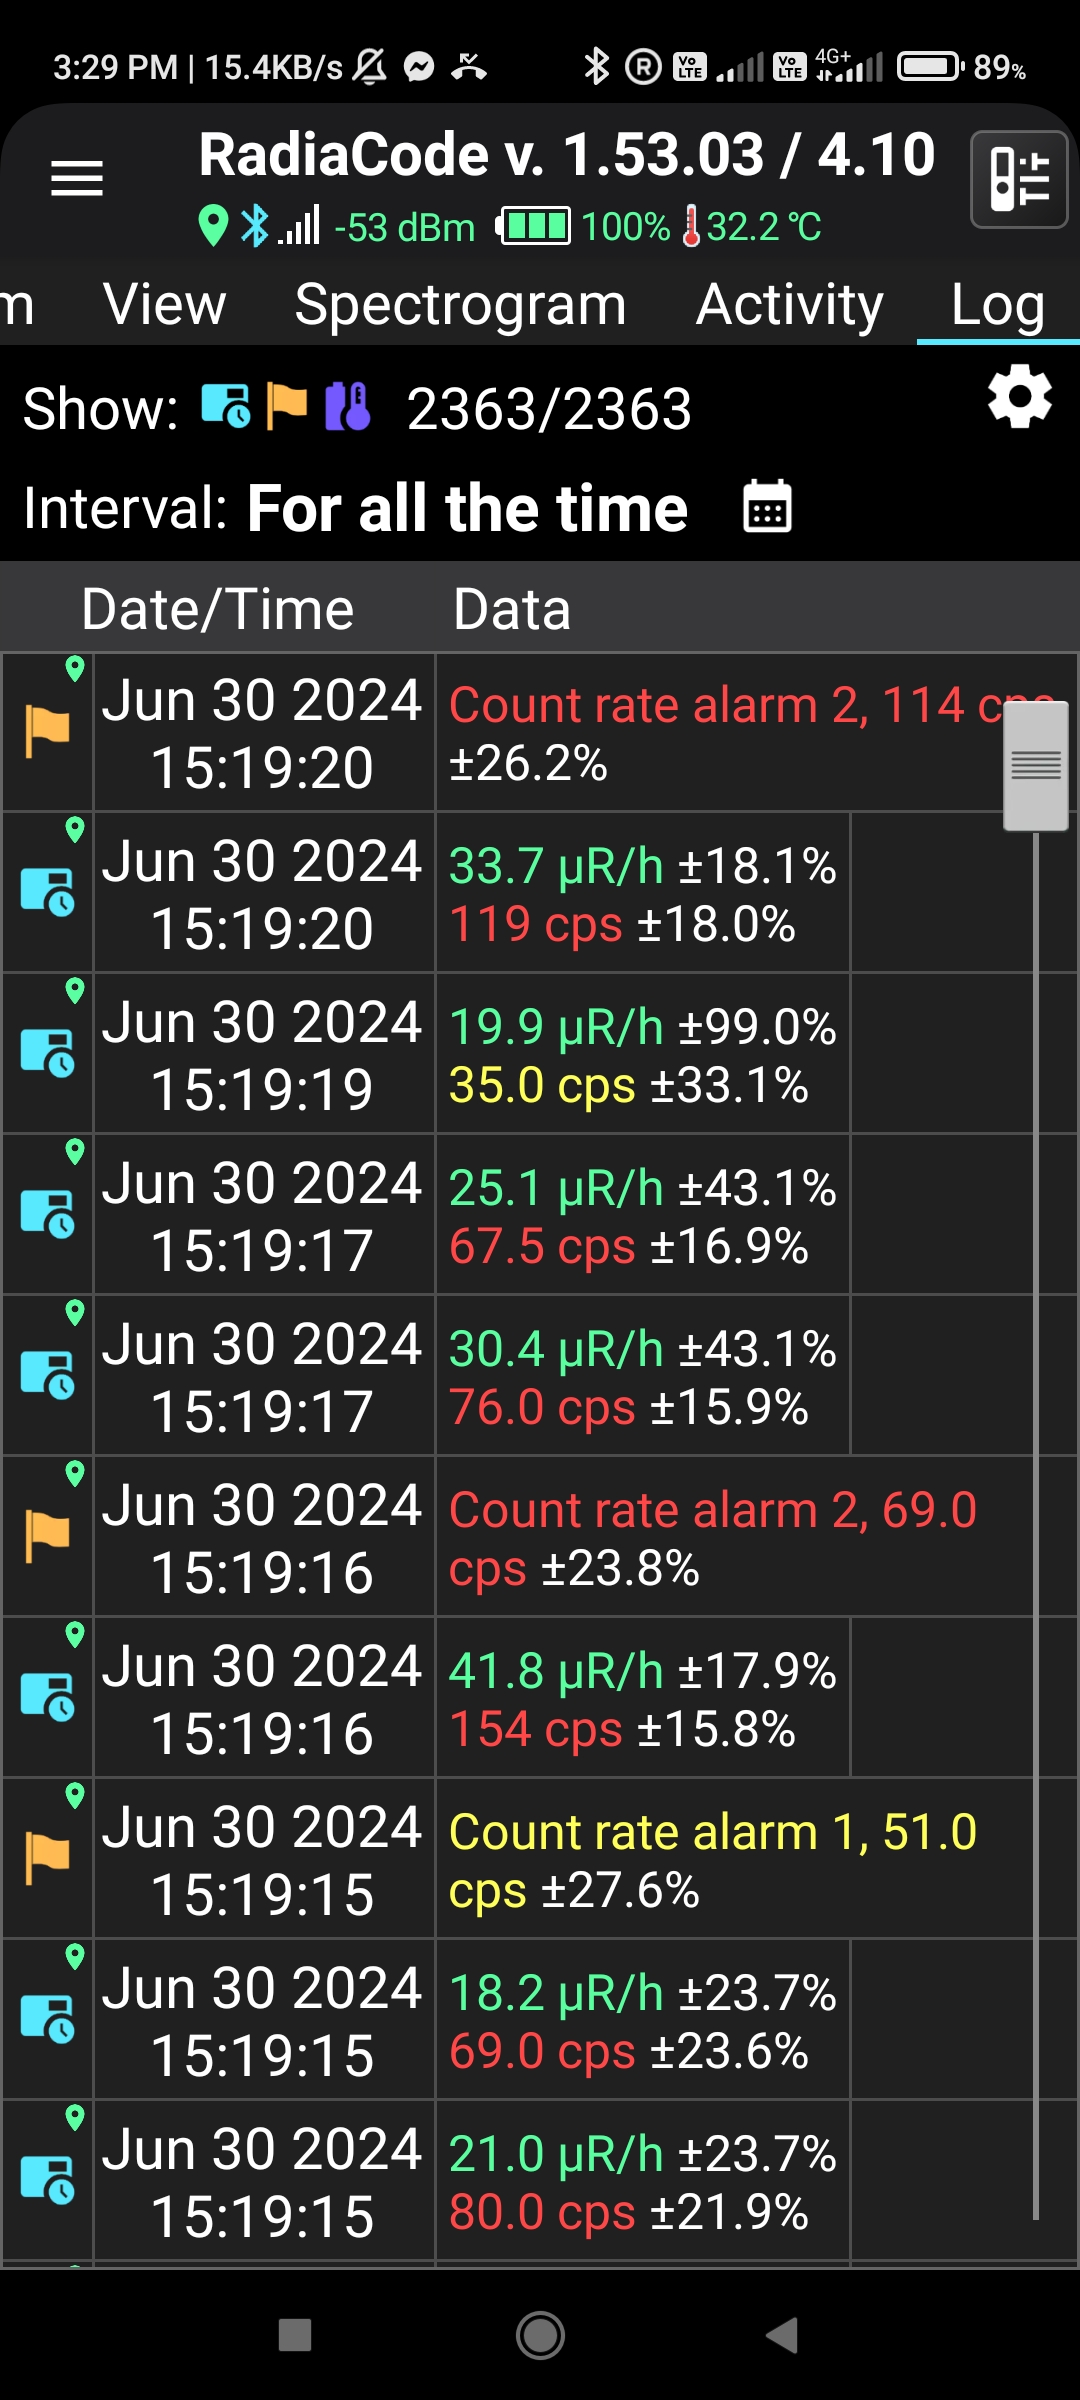
One of the modes of operation of the smartphone software accompanying the unit is the "search" mode, where you get analogic dials showing counts per second and dose rate, or if you prefer a running graph of the counts. There, an occasional rate alarm will be also shown by a clear peak. It is nice that the app allows you to switch between this visualization and all others, and you get to see the full history from time graphs (as the one on the bottom in the figure below):
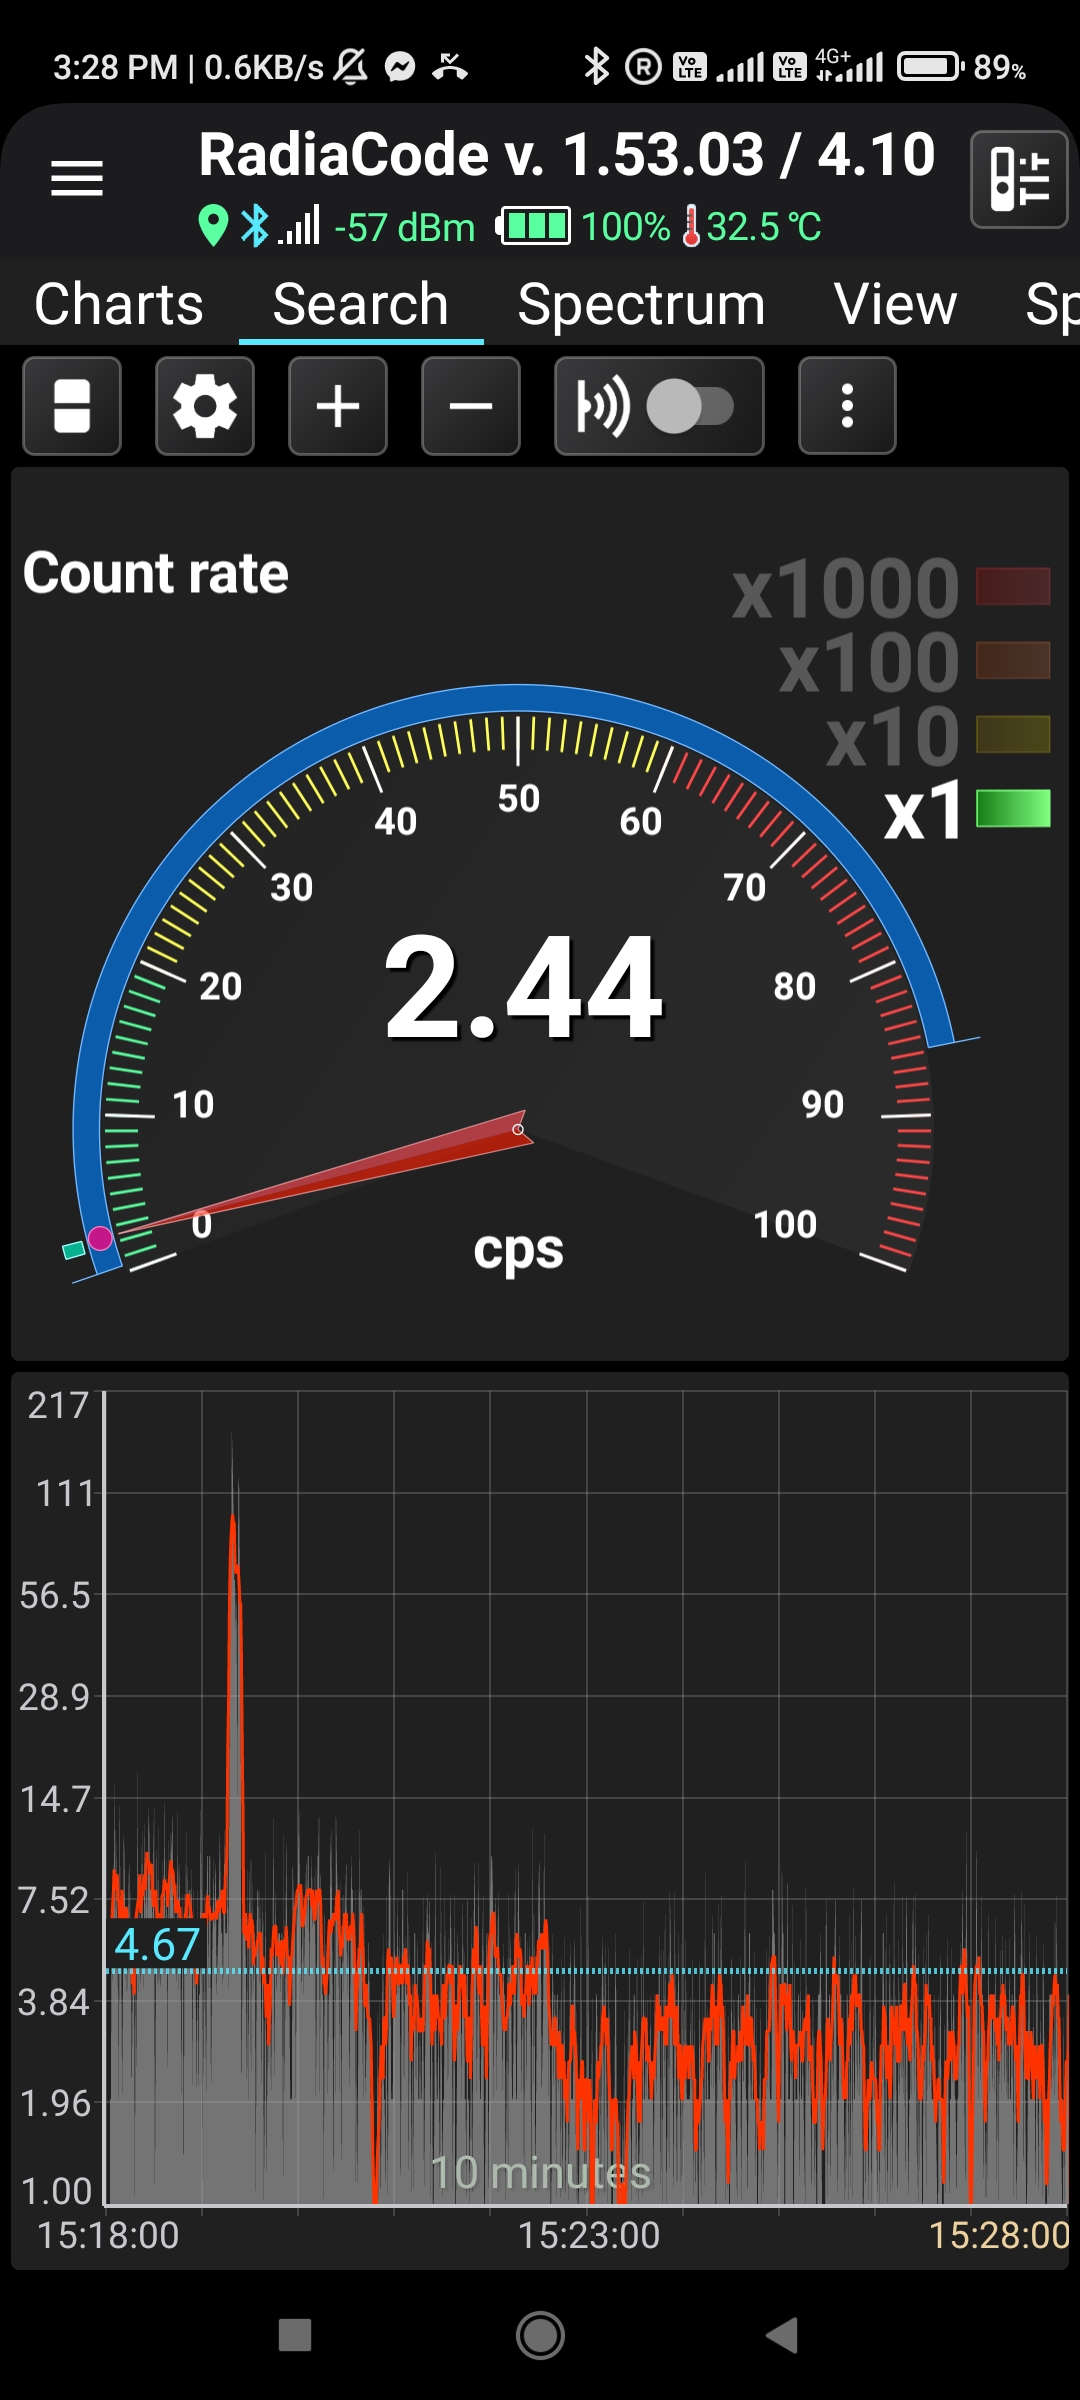
Above: a spike in the counts per second at 15:19:20" towers above backgrounds. This is the signal that generated two distinct alarms.
You have also access to a full log of the events of interest through the app, and in this case you get to see exactly what happened and when:
Going back to the map feature, which is only available when you connect your device to a smartphone (via USB or via bluetooth): it is a lot of fun. Just turn it on and walk or drive around, and the instrument will colour the map with precise readings of the radiation field, creating a "temperature map" of the activity of the area. Below, for instance, is the area of Padova between my home and the department of Physics. Note how the colouring of the paths I walked through has a structure - it is not just a collection of random colours: this reflects real differences in the radiation field along the paths, rather than fluctuations. This highlights how the instrument's response is not driven by random counts, but by a steady reading of the average radiation field, something which can be only pulled off if you have a sufficient sensitivity.
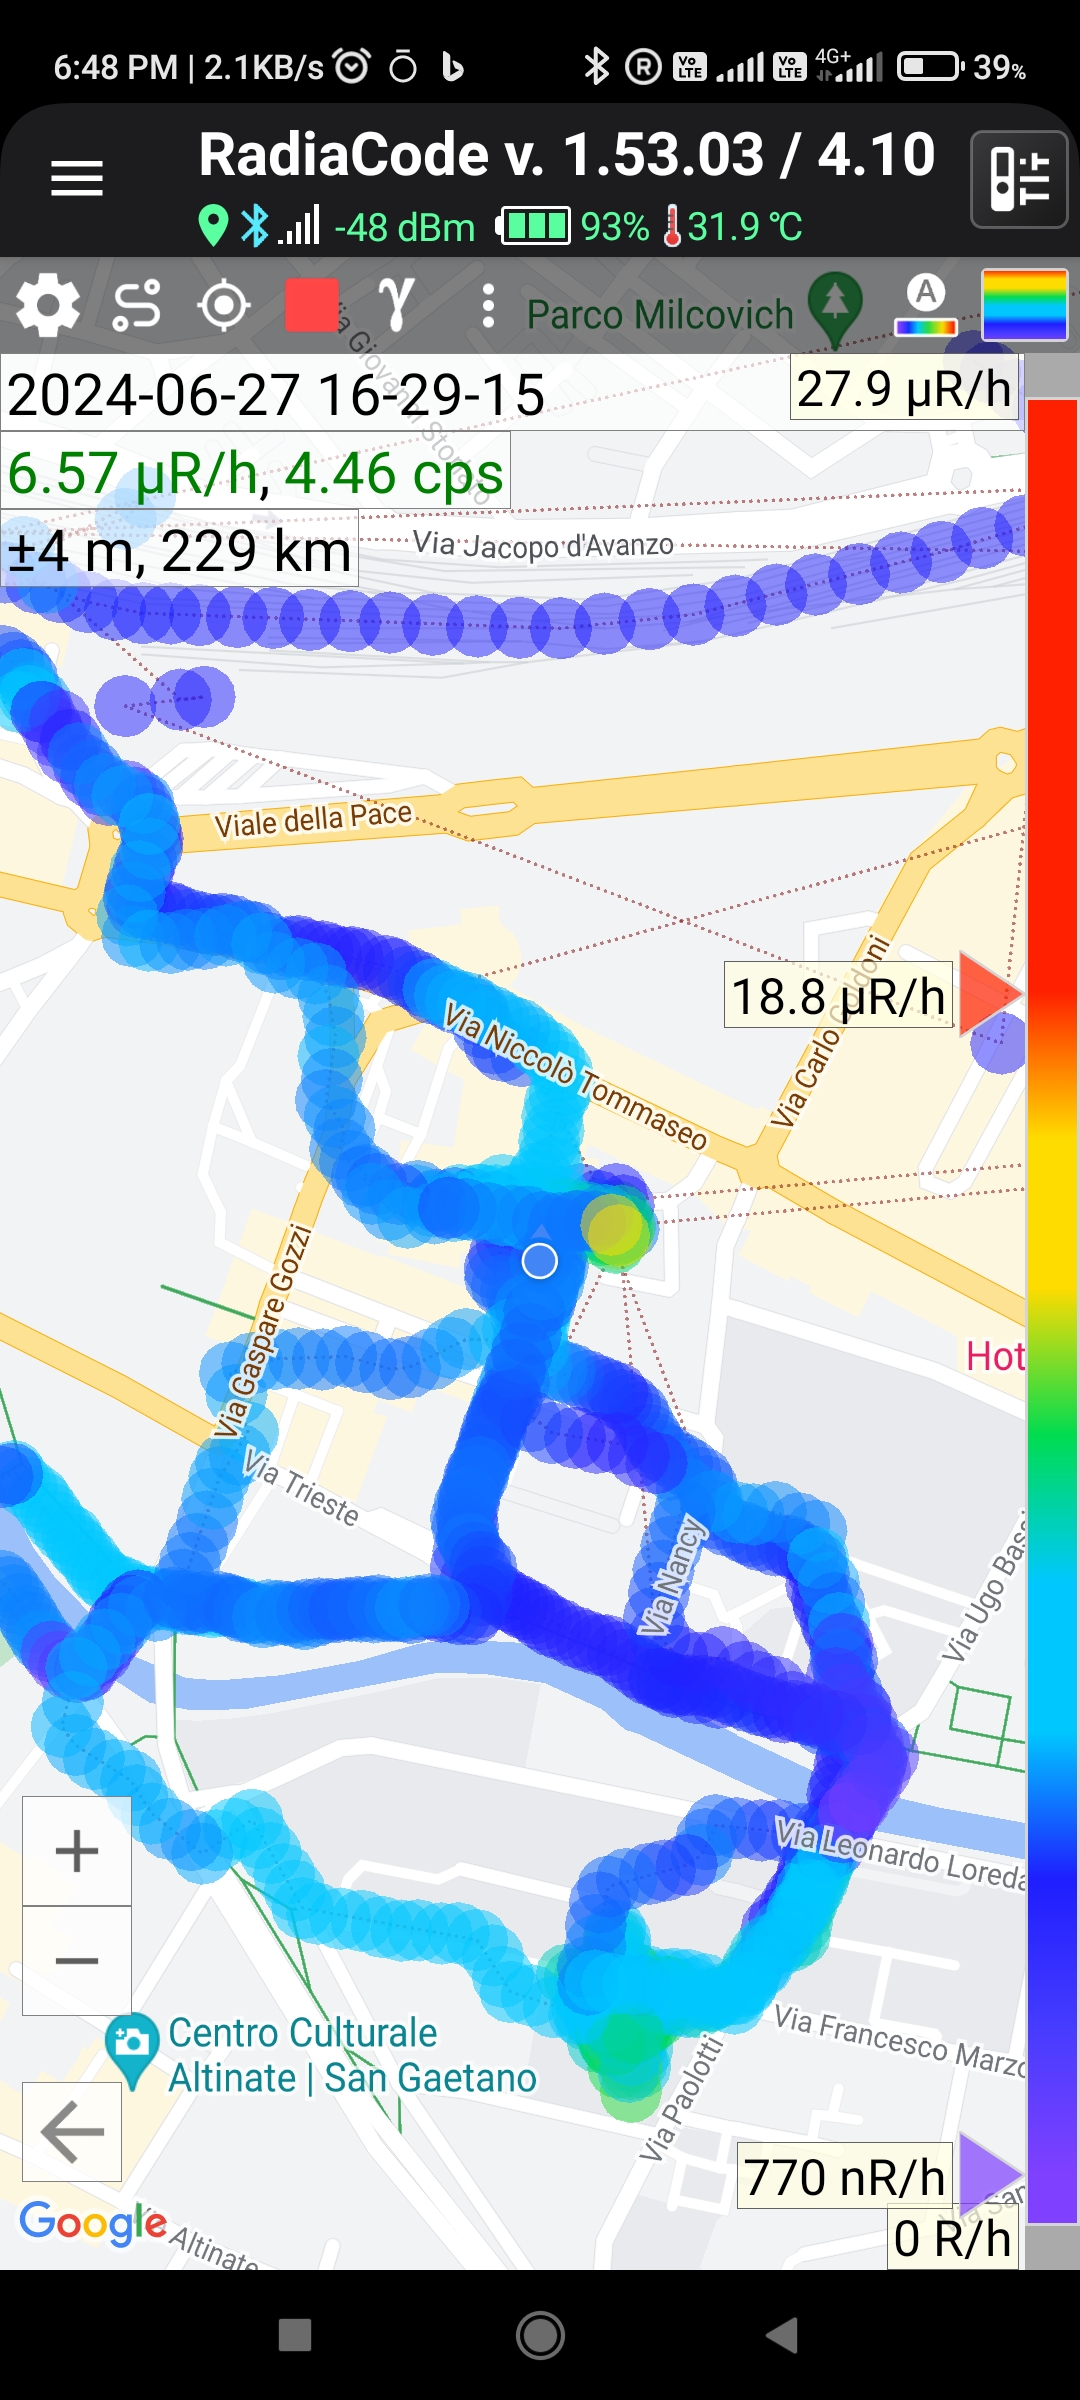
Above: Map of the center of Padova with radiation readings. The streak on top was taken on a train (the points are more separated as the train was moving fast). Also note the green dots at the bottom, where I measured the radiation in the interior of the Physics department building.
In the map, the yellow point is my home - the interior of buildings always has higher radiation readings, due to radon contamination (radon is produced by thorium decay, and thorium is present in rocks). Note that if you walk twice by the same spot, the algorithm recomputes the rate by doing an average, so that you always get an updated map, and the more you use it, the more precise the map will become.
The map comes with many options. They e.g. allow you to colour it with either readings (in mRem or mSieverts per hour) or counts per second, to choose the colour palette, zoom in/out, to remove readings (e.g. if you included in the recording a moment when you tested a radioactive source, which creates an "overexposed" point that does not fit with the rest), and to exclude/include readings when the positioning accuracy from the GPS is below some acceptable level.
By far the most innovative feature of the RadiaCode, when compared with other instruments of the same size and concept, is its capability to precisely determine the energy spectrum of the gamma radiation it records. The energy resolution is good enough (a quoted 7.5 to 9.5 percent of full-width-at-half-maximum is quoted, depending on the unit you purchase - the 102, the 103, or the 103g) that the instruments can evidence clear peaks from the different energy of gamma rays from radionuclides. In fact, the software uses the recorded peaks to indicate the isotopes that are producing it, using a database of the various properties of known emitters. Below, for example, is a spectrum I collected by placing the unit close to a rather hot sample of autunite (an uranium ore) I own.
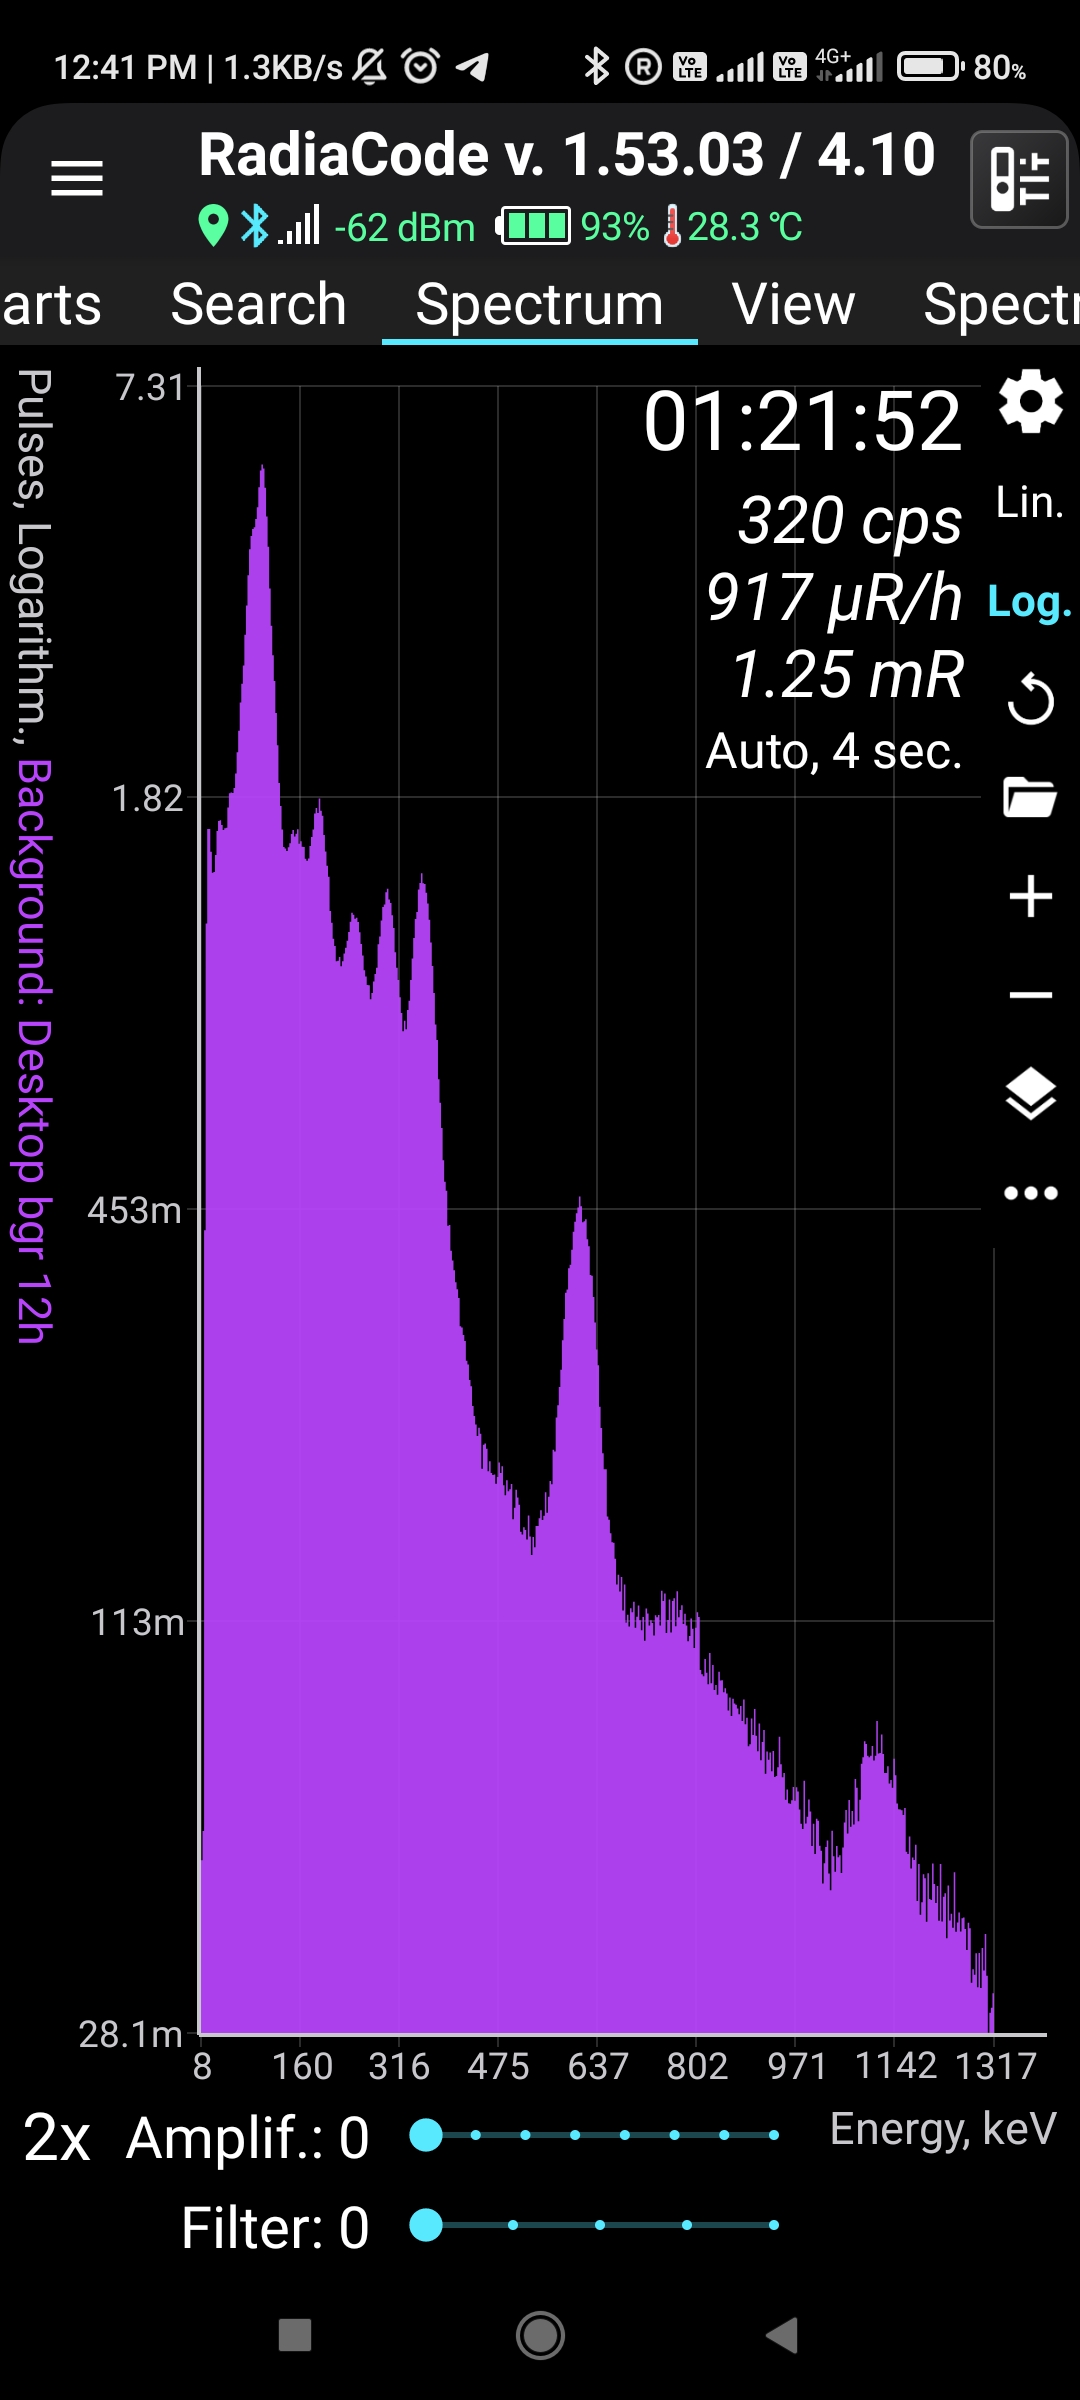
As you can see, several peaks are recorded in this spectrum. The software identifies their location as corresponding to the various isotopes produced by the chain of decays that the material produces. If I in particular isolate the 609 keV line of the Bi-214 isotope, I get the following background-subtracted shape (more on background subtraction below):
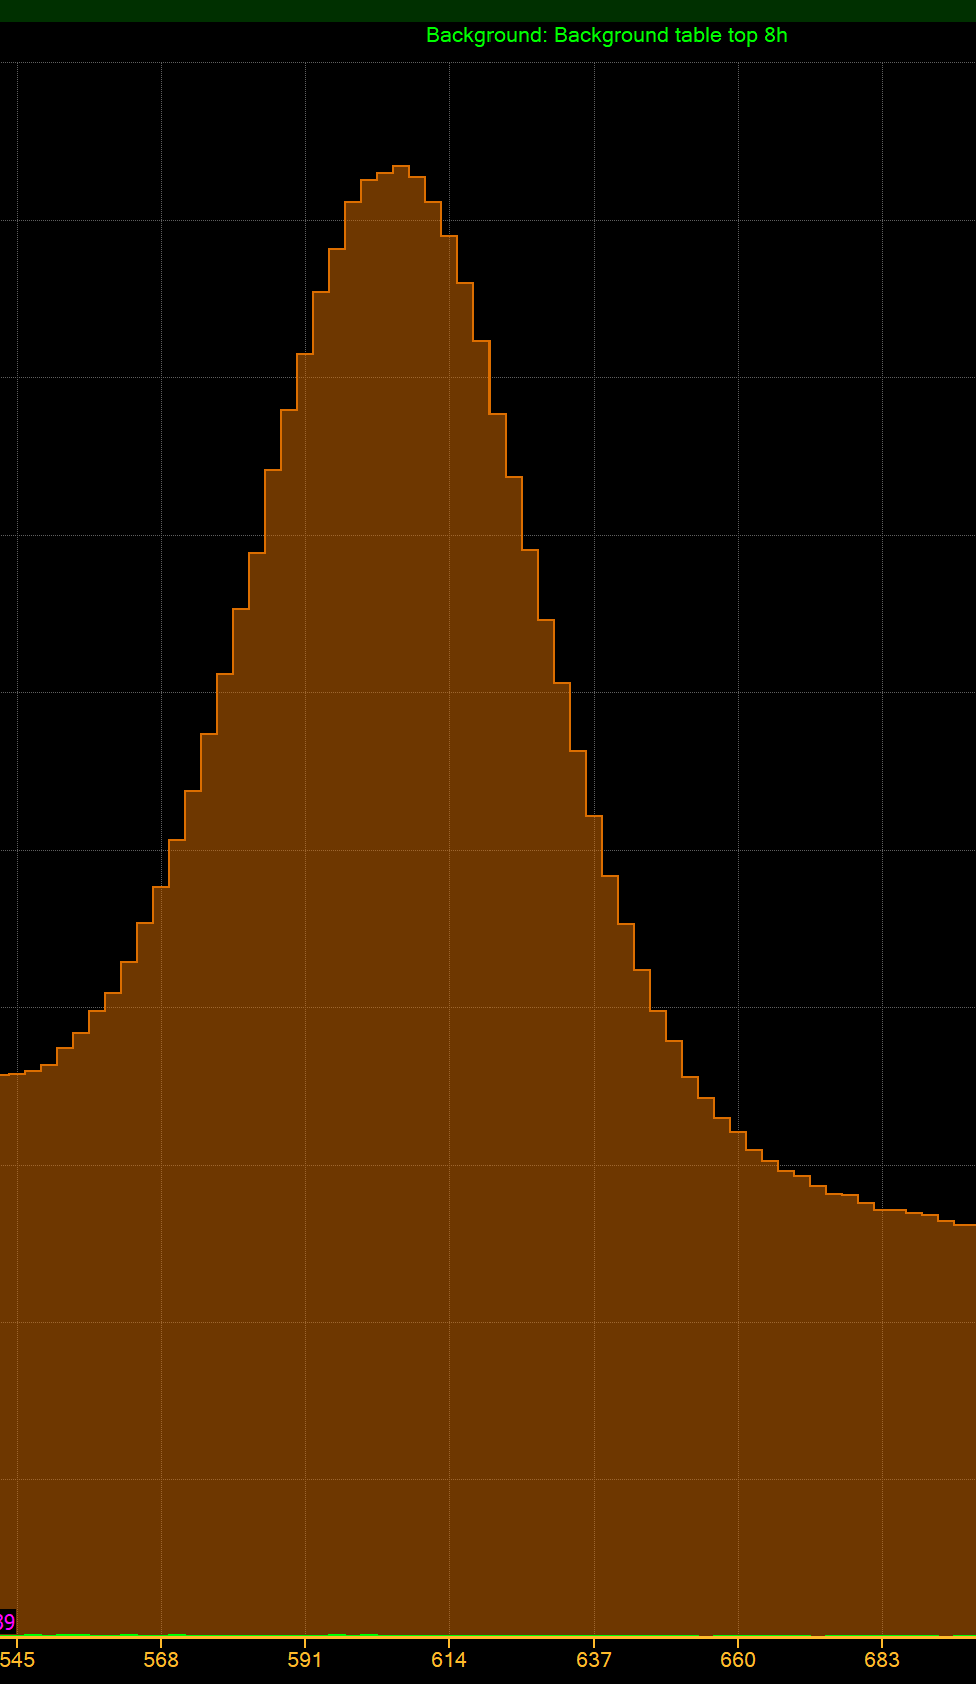
By taking the height of the peak and finding its half point, and measuring its "waist" there, this translates to a ballpark estimate of FWHM (full width at half maximum) of 51 keV, which is 8.4%, quite compatible with the quoted 8.2% of the 103 unit I have used. Well done, RadiaCode.
For today I will stop here... I will provide some more insight in the performance of this very nice instrument very soon (I already took some spectra with a Fe-55 source and with a Strontium-90 source, both thanks to my colleague Devis Pantano at the department of Physics in Padova). But as a quick summary: if you are curious about radioactivity, or of you are pessimistic on the outcome of the war in Russia and fear there will soon be radioactive fallout to be reckoned with, this thing is what you want to buy! At a price of about 350 euro, it is affordable if you plan to use it more than just twice and then throw it in a drawer. This thingy can do a lot for you - e.g., it can detect radiation contamination in food, if you use it properly. And in very special circumstances it can save your life.