More on Radiacode 110
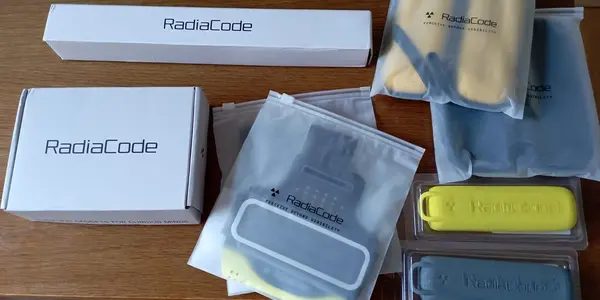
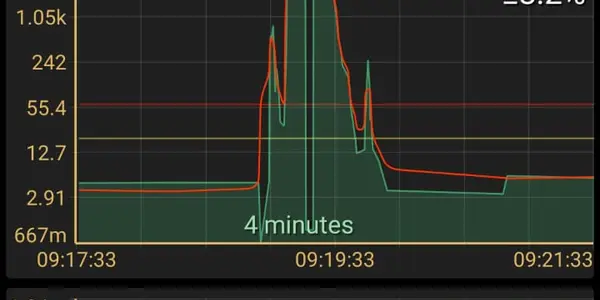
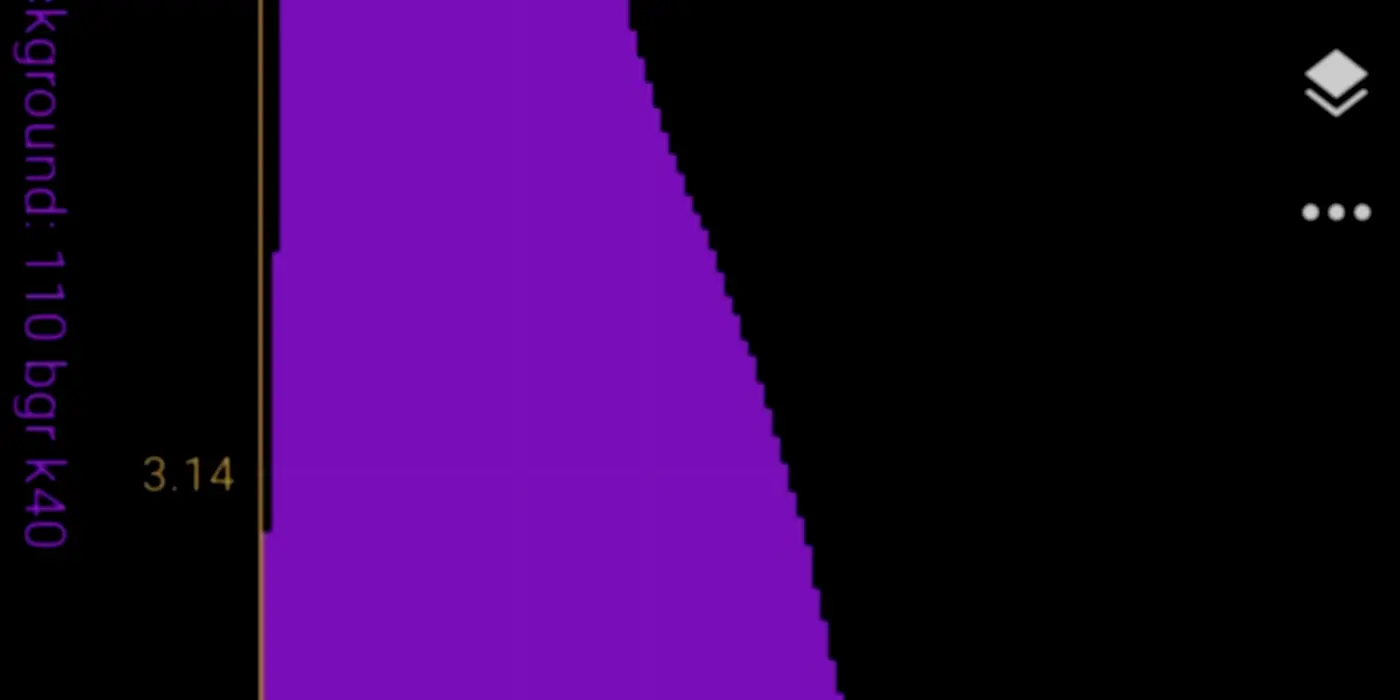
This is the second post reporting a few tests of the Radiacode 110 spectrometer, an extra-cool pocket dosimeter/radiation counter/spectrograph sold by RadiaCode.
This is the second post reporting a few tests of the Radiacode 110 spectrometer, an extra-cool pocket dosimeter/radiation counter/spectrograph sold by RadiaCode.


The Corfu Summer Institute is a well-established institution for higher education, run since the paleolithic by the inexhaustible George Zoupanos, the soul of the whole thing. Generations of physicists have been trained in doctoral schools and conferences there over the past few decades. Of course the beauty of the island, set in the Ionian sea and green from the top of its mountains to the blue sea below, has helped to keep the events there well-attended, and even during the pandemic the events have been run in person.
I used some spare research funds to open a six-months internship to help my research group in Padova, and the call is open for applications at this site (the second in the list right now, the number is #23584). So here I wish to answer a few questions from potential applicants, namely:1) Can I apply? 2) When is the call deadline?3) What is the salary?4) What is the purpose of the position? What can I expect to gain from it?5) What will I be doing if I get selected? Answers:

When you collide particles made up of quarks and gluons, such as the protons accelerated by the Large Hadron Collider at CERN, you mostly expect particles made of quarks and gluons to emerge. That is because quarks and gluons most of the times interact by the strong interaction, which is itself mediated by the exchange of gluons; and the strong interaction knows nothing about all the other matter and interaction fields.So how do you get energetic electrons, muons, photons, and weak bosons from a LHC collision? Well, the electroweak interaction which may produce these particles does play in, but its contribution is, er, weaker, by definition. Gimme all 'em leptons!

In the ancient past, when a good portion of blog followers were interested in the writers' lives more than in actual content, I used to write a lot more about private issues here. I don't do that so often any more mainly because I think the interest of readers has shifted - or better, the composition of readers has changed. But I am not less keen to discuss private issues today than I was ten years ago. Privacy is not among the priorities of a blogger true to him- or herself anyway, at least from my point of view.So, what am I up to these days? I thought I could give you some update. Maybe in one of my future posts I will also summarize the various research activities I am engaged in as of late, but let's keep this out of today's post.
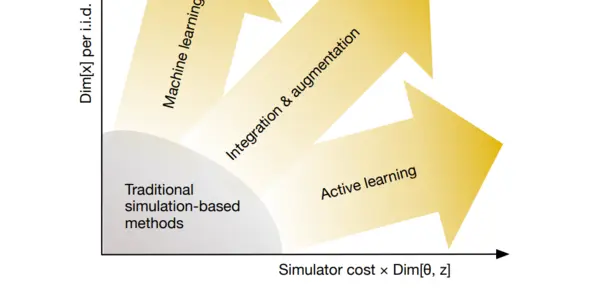
Today I am giving the opening speech at a workshop with the same title of this post. The workshop takes place at the Center for Particle Physics and Phenomenology of Université catholique de Louvain, in Belgium, and it is in a mixed formula - we will have 33 in-person attendees and 72 more attending by videolink. The workshop is organized by the MODE collaboration, which I lead. It is a small group of physicists and computer scientists from 10 institutions in Europe and America, who have realized how today's deep learning technology allows us to raise the bar of our optimization tasks - we are now targeting the full optimization of the design of some of the most complex instruments ever built by humankind, particle detectors.
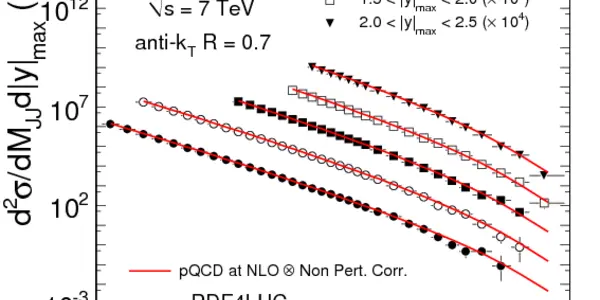
In the third part of this long piece on graphical displays and their interpretation, I wish to discuss some properties of two-dimensional distributions, which are sometimes called "scatterplots" (especially by physicists), or also "temperature plots" (when colour is used to give a sense of the density of data in the two-dimensional plane). In this post we will consistently label "X" the variable on the horizontal axis, and "Y" the variable on the vertical axis, but there is no hierarchy between them - they should be considered equally important.
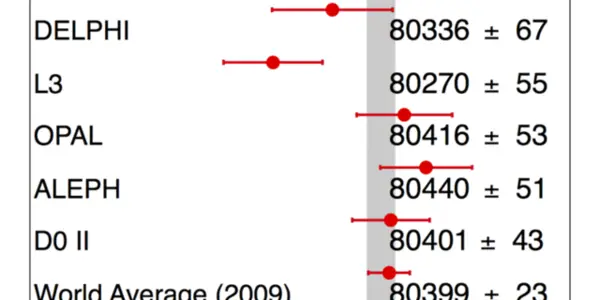
In a recent post I discussed how even the simplest kind of data display graph - the histogram - can sometimes confuse and be misinterpreted. Which is a total howler, as graphs are supposedly means of clarification and immediate, at-a-glance, interpretation of data summaries.

The discovery of a new exotic hadron, named T_cc+, was announced by the LHCb Collaboration a little over a week ago. Unlike some previous discoveries of other resonances by the LHC experiments (dozens have been announced since 2010 by LHCb, and to a lesser extent by CMS and ATLAS) the one of the T_cc+ is is very significant and exciting, and it promises to advance our understanding of low-energy QCD, with repercussions across the board.
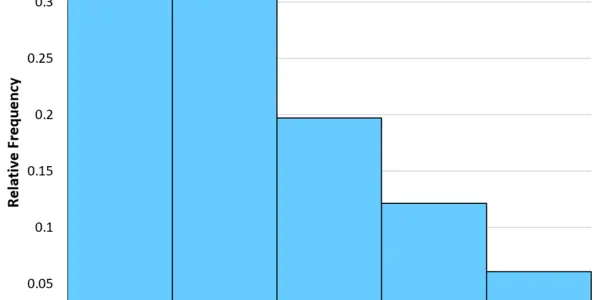
Time and again, I get surprised by observing how scientific graphs meant to provide summarized, easy-to-access information get misunderstood, misinterpreted, or plainly ignored by otherwise well-read (mis-)users. It really aches me to see how what should be the bridge over the knowledge gap between scientists and the general public becomes yet another hurdle.

When subnuclear particles traverse matter they give rise to a multitude of physical phenomena. The richness of the different processes is a crucial asset for the construction of sensitive particle detectors, and it is interesting in its own right. Indeed, it has been a very vigorously pursued field of research of its own ever since the end of the nineteenth century, with the discovery of X rays(produced when electrons released their kinetic energy as they reached the cathode of an accelerating tube), and then after Rutherford's team bombarded gold foils with alpha particles (helium nuclei) emitted by a radioactive substance.
The virtual conference "From Quarks to Cosmos with AI", organized by Carnegie-Mellon University and which took place last week, included a set of problems in particle and astroparticle physics that participants were invited to tackle with machine learning tools, during four 2-hour afternoon sessions.I took part to the conference by lecturing about applications of differentiable programming to fundamental physics, as well as by organizing (with my collaborators Giles Strong and Lukas Layer) a data challenge centered on a tough regression problem.
With the delta variant of Covid-19 surging in many countries - e.g., over 100,000 new cases per day foreseen in the UK in the next few days, and many other countries following suit - we may feel depressed at the thought that this pandemic is going to stay with us for a lot longer than some originally foresaw.In truth, if you could sort out your sources well, you would have predicted this a long time ago: epidemiologists had in fact foreseen that there would continue to be waves of contagions, although at some point mitigated by the vaccination campaigns. However, so much misinformation and falsehood on the topic has been since dumped on all media, and in particular on the internet, that it is easy to pick up wrong information.