More on Radiacode 110
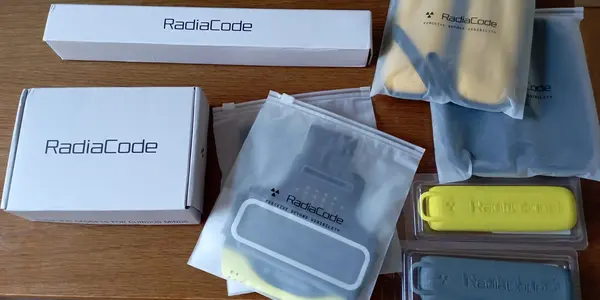
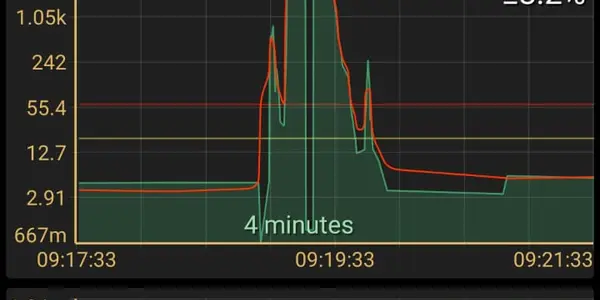
This is the second post reporting a few tests of the Radiacode 110 spectrometer, an extra-cool pocket dosimeter/radiation counter/spectrograph sold by RadiaCode.
This is the second post reporting a few tests of the Radiacode 110 spectrometer, an extra-cool pocket dosimeter/radiation counter/spectrograph sold by RadiaCode.

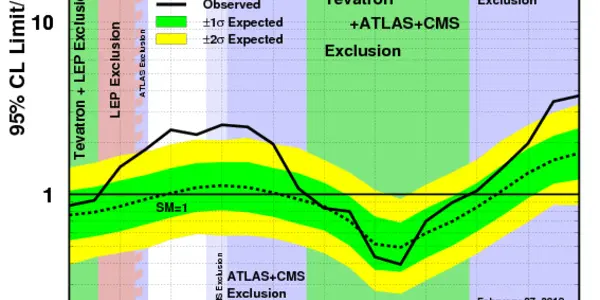
2.2 standard deviations. That is what the combination of CDF and DZERO searches for the Higgs boson yield, according to a release of the interactions news wire.The talks on Higgs searches are scheduled for this morning at the Moriond Electroweak conference in La Thuile, a nice ski resort in the Italian alps. The money plot is the one below, which shows the upper limit on the Higgs boson production rate, in units of the Standard Model expectation (y=1 on the vertical axis corresponds to the SM Higgs production rate, for the particular mass identified by the abscissa in the graph).
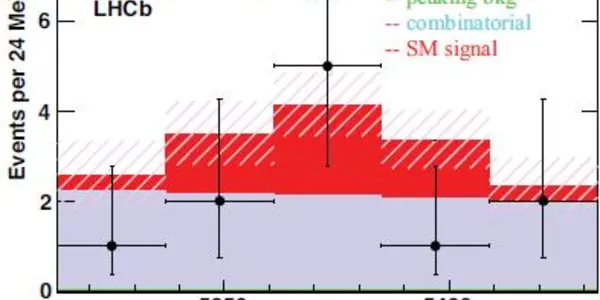
The Moriond EWK conference is in full swing and results are being shown of the recent new searches for rare decays of the Bs meson. The Bs is a hadron made up by a bottom quark and a (anti)strange one. The peculiar composition of this particle and its zero electric charge make it a very interesting probe of new physics in its decays: new physics processes might give a sizable contribution to the rate of decays yielding pairs of muons, which are both very rare in the standard model, and very easy to identify in the detector.
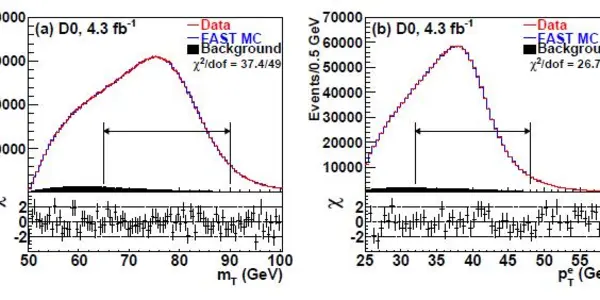
Just a few days ago the CDF collaboration announced their new measurement of the W boson mass, with a considerable improvement over the precision of the current world average for that quantity. Now DZERO, the competitor experiment, has also published their own new measurement, which is based on a statistics of 4.3 inverse femtobarns - twice as many data as the ones used by CDF.

As today I have just published a piece on CP violation which lacks detail on the theoretical aspects of the issue, I think it is a good time to offer you here a post on the matter written by Carl Brannen, a independent researcher and now Ph.D. student who is a great example of how what is typically dubbed "crackpottery" can at times convert into accepted science. Carl has managed to get a few of his papers accepted for publication, but he remains "on the edge", dealing with issues that many frown upon. Maybe he is right, or maybe he is not, but I sympathize with his approach, so I occasionally offer him this site for his pieces [TD].

A long awaited confirmation that direct CP violation occurs in Bs mesons (particles composed of a b- and an s-quark) not unlike what happens to lighter mesons (the K0, the B0, and the D0) is coming from LHCb. In an article appeared yesterday in the Cornell arxiv, LHCb describe their measurement of direct CP violation in the decays of both B0 and Bs mesons to Kπ final states (a kaon and a pion). The former is now the best precision measurement we have of the phenomenon, the latter is also the most precise bid (only one former measurement of the effect exists).
Today Greenpeace issued the 52-page report "Lessons from Fukushima". In it the Japanese nuclear catastrophe is analyzed in detail, and its causes and consequences exposed. The report correctly focuses on a few crucial issues: the lack of accountability for the disastrous consequences of nuclear incidents, the lack of a correct approach to the potential risks involved in the production of nuclear energy, and the failure of proper emergency planning.
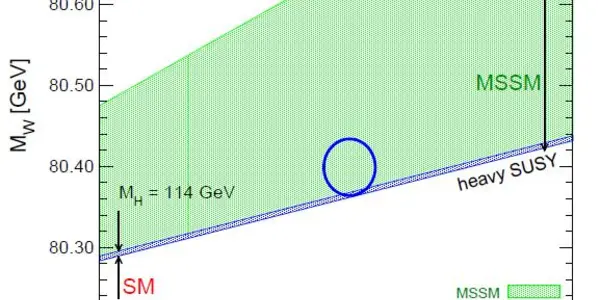
Thanks to Sven Heinemeyer and his colleagues, we can give a peek today at the status of the agreement of top and W boson masses with Standard Model predictions for the Higgs boson mass, and with SUSY predictions as well. The figure below is just one of the many versions he has produced.Maybe I should not say "SUSY predictions", as it is clear, by inspecting the figure above, that the green band is quite wide, a result of the many free parameters whose value have an impact in determining the mass of the lightest Higgs scalar.
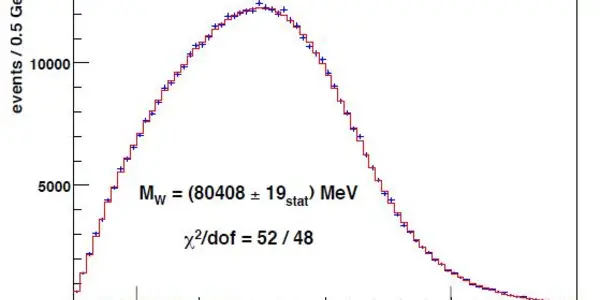
The Tevatron collider has been shut down for almost half a year now, but the CDF experiment is still busy producing world-class measurements of fundamental Standard Model parameters. Actually, the above is not quite correct: CDF is re-defining "world class" in some cases. The measurement I am going to describe, which has just been made public (if you are quick you can follow live the seminar presented by Prof. Ashutosh Kotwal at Fermilab here), totally outperforms all previous determinations of a crucial ingredient of the Standard Model: the W boson mass.
This just in: the controversial Opera result on superluminal neutrinos is affected by a previously unaccounted for experimental error, which completely overturns the conclusions.This is explained in detail here. Note that the source is James Gillies, head of Communications at CERN, and thus hardly a "unofficial leak". In fact, tomorrow there will be a CERN press release on the matter.The relevant quote is the following:
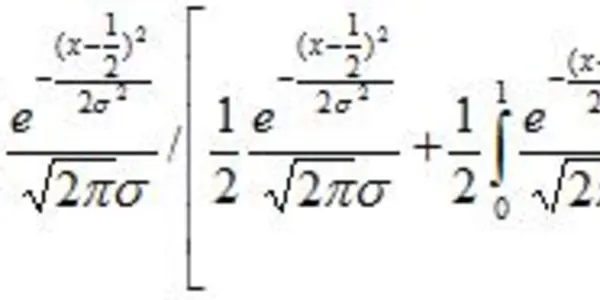
About a month ago I held a three-hour course on "Statistics for Data Analysis in High-Energy Physics" in the nice setting of Engelberg, a mountain location just south of Zurich. Putting together the 130 slides of that seminar was a lot of work and not little fun; in the process I was able to collect some "simple" explanatory cases of the application of statistical methods and related issues. A couple of examples of this output is given in a post on the fractional charge of quarks and in an article on the weighted average of correlated results.
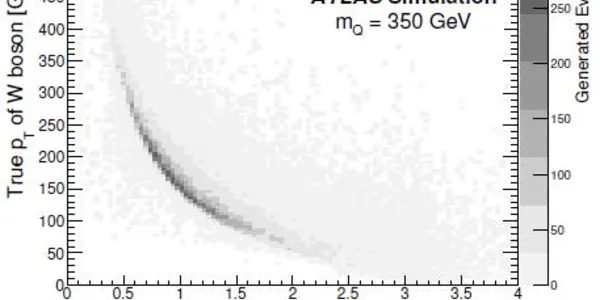
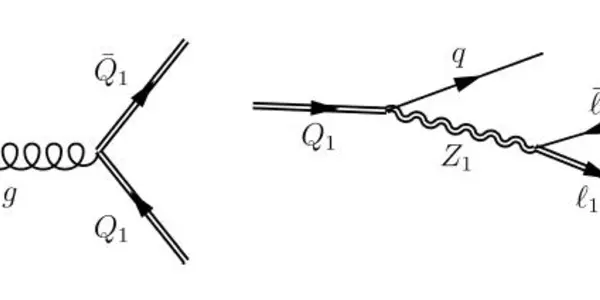
A nice new search for heavy quarks has been completed by the ATLAS collaboration in 7 TeV proton-proton collisions data collected in 2011. The ideas behind the search are instructive to describe, so I will spend some time trying to do that before I discuss the results and their meaning.Quarks: properties and decays
Of the dozens of new physics models which are currently on the market of Standard Model extensions and plug-ins, the ones hypothesizing the existence of additional dimensions of space-time beyond the 3+1 we know about are definitely among the most fascinating.